I’ve always learned how Linux’s memory management works in bits and pieces, never in a formal or focused way. Recently at work, I had to debug some OOM kills, and I felt like I struggled a lot because I didn’t have a solid foundation in Linux memory management. This guide distills what I’ve learned after doing some research.
Virtual Memory
Every process has its own virtual address space. The OS and CPU translate virtual addresses into physical addresses, allowing memory to be backed by physical RAM and by disk through mechanisms such as swap. This gives us several benefits:
- One process can’t normally access another process’s memory. Without this isolation, a program could potentially read or modify another program’s memory, creating security issues.
- The OS and CPU handle the translation from virtual addresses to physical memory addresses, so each process can think it has its own set of addresses.
- Virtual memory allows the system to use more memory than physically fits in RAM. Pages that aren’t currently needed can be moved to disk (swap), freeing RAM for other data.
Reference:
- Virtual Memory Explained - BitLemon (YouTube)
- Introduction to Memory Management in Linux - The Linux Foundation (YouTube)
- Virtual Memory - David Black-Schaffer (YouTube)
Pages & Page Tables
A page is a fixed-size block of virtual memory, typically 4 KiB. These pages are mapped by page tables to page frames, which are fixed-size blocks in physical memory (RAM) of the same size as a page.
Reference:
Anonymous vs File-backed Memory
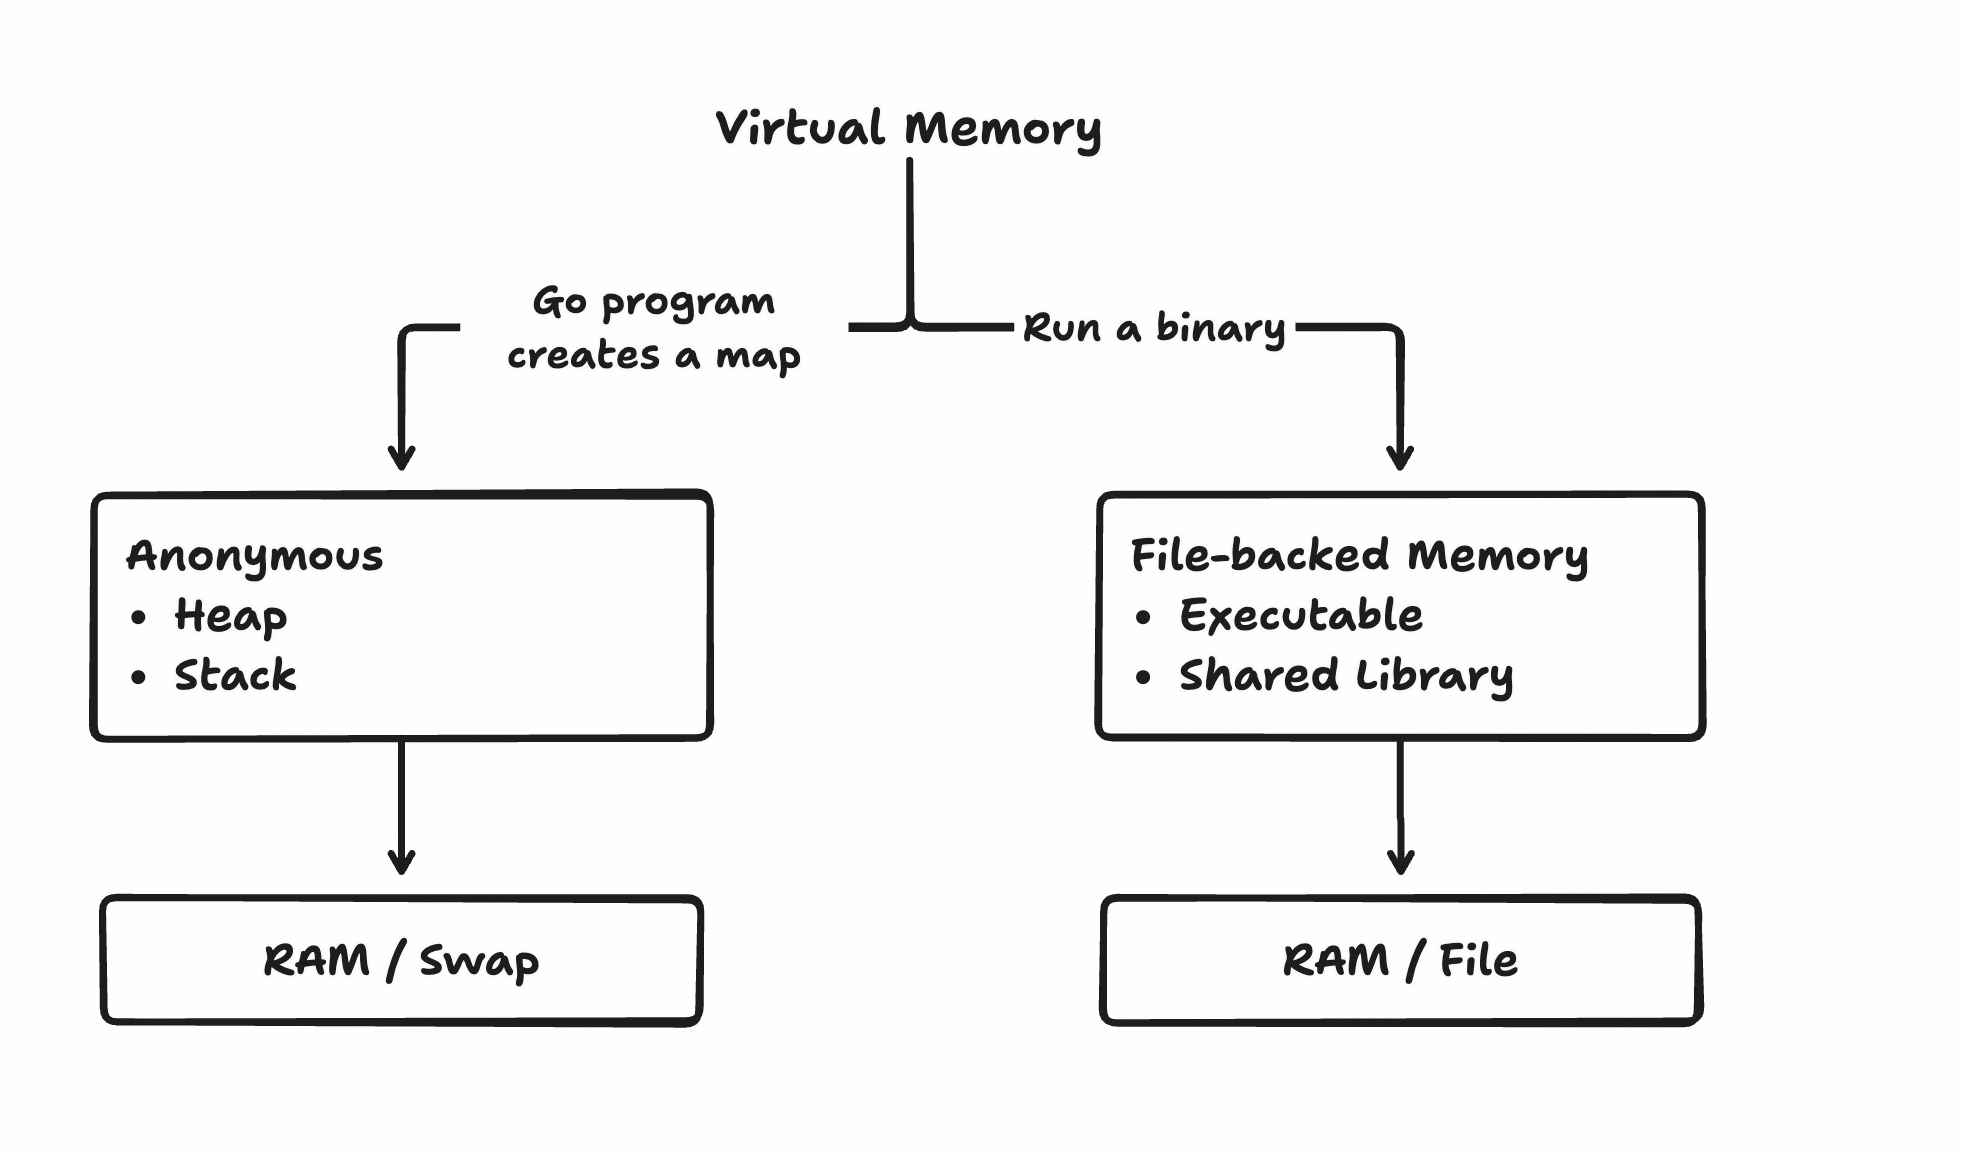
Anonymous memory consists of pages that aren’t backed by a file or filesystem.
It is commonly used for things like a program’s heap and stack, as well as memory allocated through anonymous mmap().
File-backed memory consists of pages that correspond to a file, such as an executable, a shared library, or a file mapped with mmap().
Reference:
Page Cache
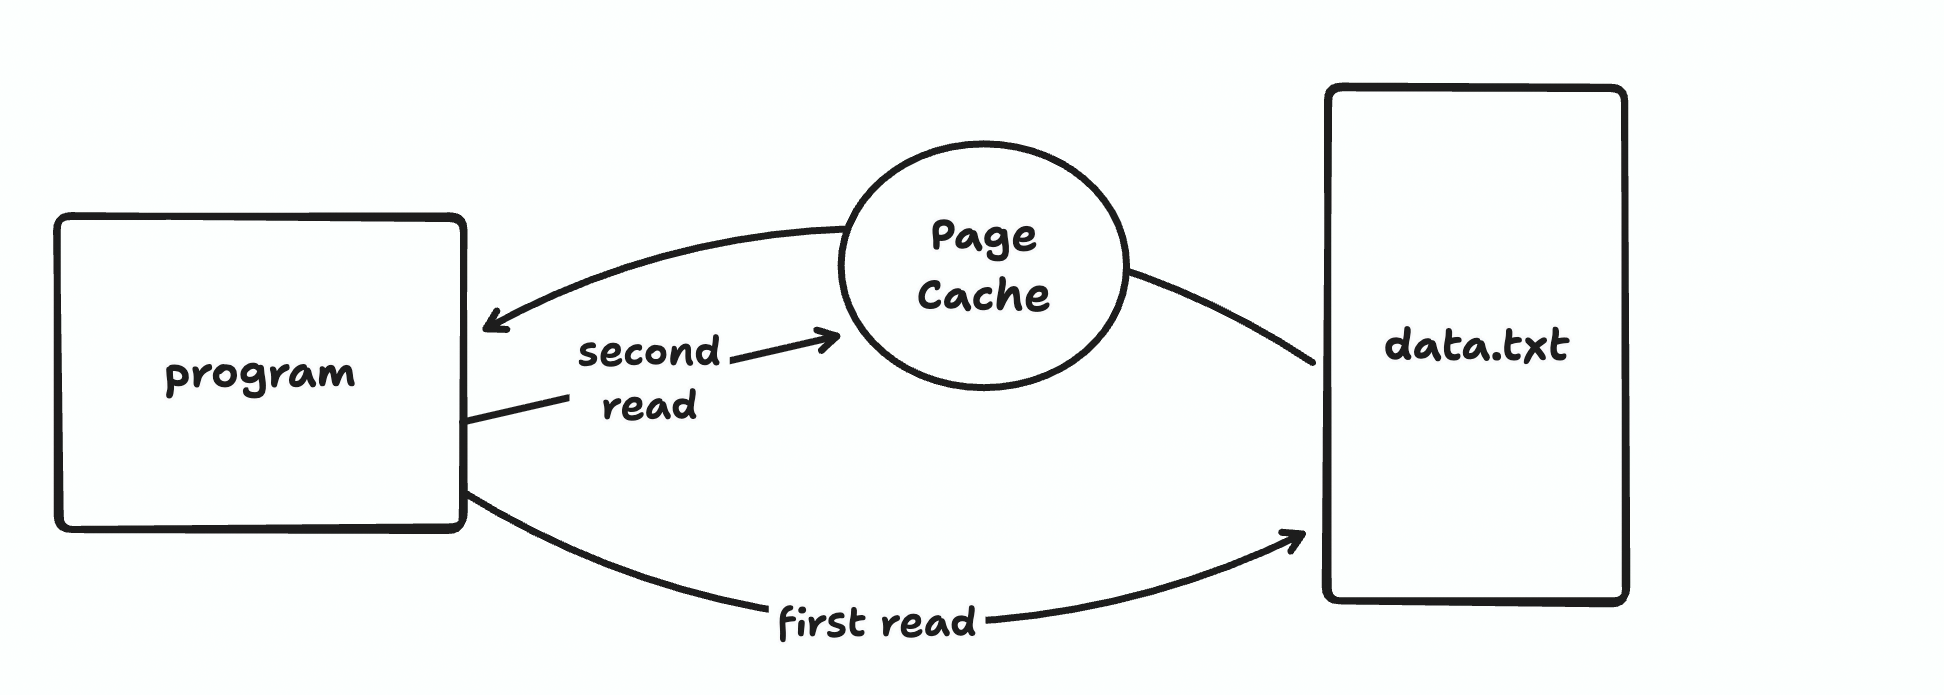
When you read a file from disk, like data, _ := os.ReadFile("data.txt"), the data comes from disk the first time. If you read the same file multiple times, it isn’t read from disk every time, because after the first read it’s stored in memory in the Page Cache.
When you run the command below
$ free -h
               total        used        free      shared  buff/cache   available
Mem:           3.8Gi       528Mi       1.8Gi       1.0Mi       1.6Gi       3.3Gi
Page Cache falls under the buff/cache.
You might think that Linux is using a lot of page cache and will not leave enough memory for your program.
Linux uses unused RAM for page cache to improve performance, but as soon as there is some memory pressure, Linux can reclaim the memory from clean pages.
Reference:
Dirty Pages & Writeback
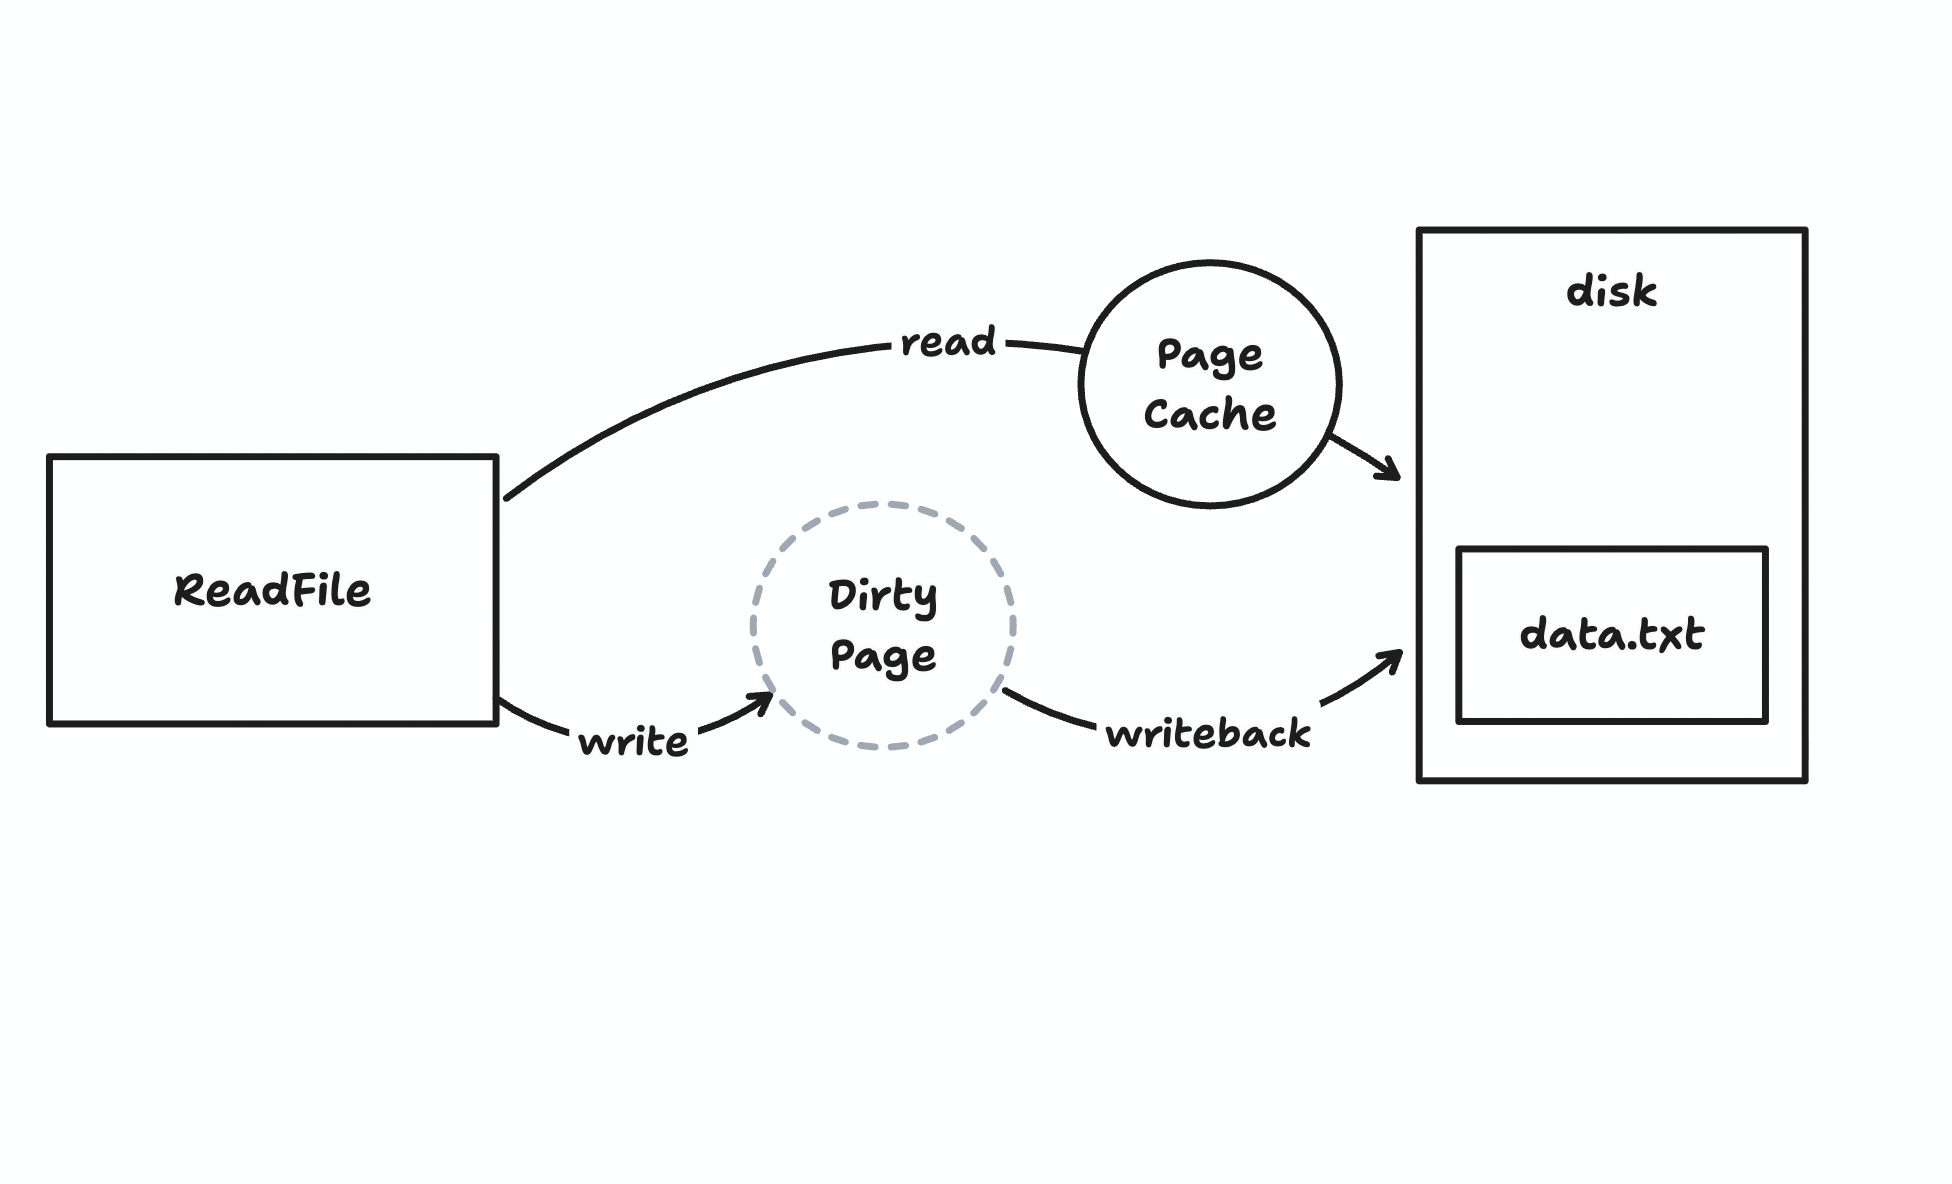
When we write to a file like f, _ := os.OpenFile("data.txt", os.O_WRONLY, 0644) with f.Write([]byte("hello")), the data goes into the Page Cache, and that Page Cache page becomes a Dirty Page. It’s not written to disk immediately.
This is a performance optimization since storage I/O is slower compared to memory.
Writeback is the process that takes Dirty Pages and writes them to disk.
As with anything, there is a balance between how many dirty pages you want and how much free memory you want, so that anonymous memory can burst and use it.
There are a few settings that you can tune from /proc/sys/vm/:
dirty_background_bytesdirty_background_ratiodirty_bytesdirty_ratiodirty_expire_centisecsdirtytime_expire_secondsdirty_writeback_centisecs
Reference:
Reclaim
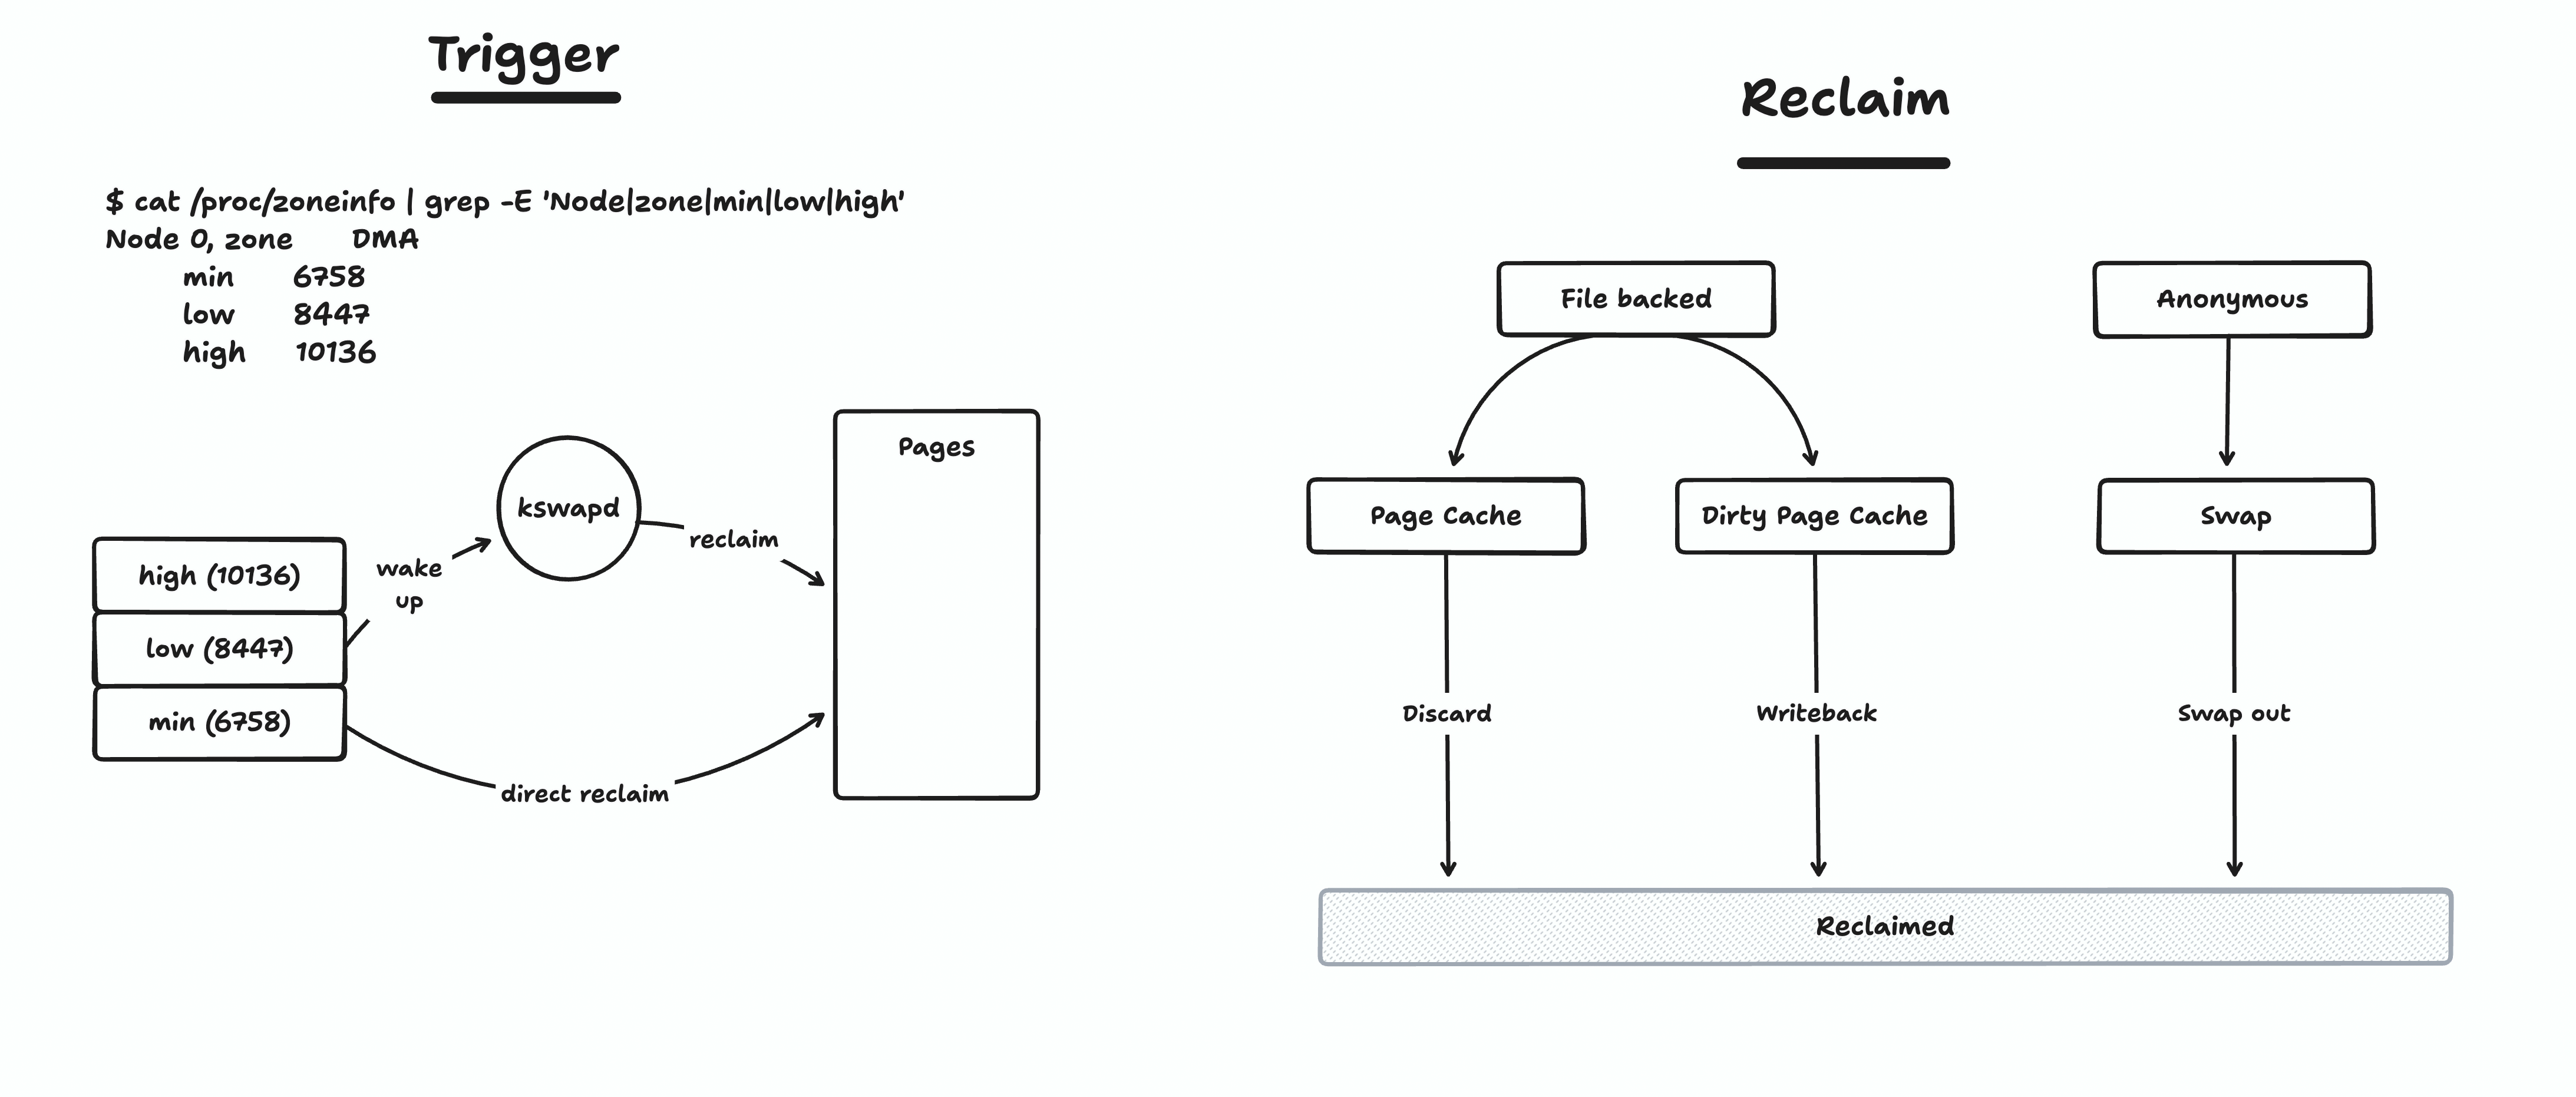
You can’t keep allocating Pages indefinitely; at some point you’ll run out of memory. That’s why the kernel will Reclaim memory so that physical pages can be made available for new allocations, and it can do so with the following methods:
- Dropping Page Cache: any clean pages can be dropped immediately since we can get them from disk.
- Writeback: writing dirty file-backed pages back to storage, then reclaiming those pages.
- Swap: anonymous pages can be written to the swap file usually on disk.
If reclaim can’t free enough memory to satisfy an allocation, the last resort is the OOM killer, which we’ll cover below.
Memory can be Reclaimed both synchronously and asynchronously:
- Asynchronous: a background process
kswapdis triggered when thelowwatermark is reached and starts reclaiming memory until thehighwatermark is reached and goes back to sleep. - Synchronous: if a process needs to allocate memory but there aren’t enough free pages available, the allocating process can enter direct reclaim and try to reclaim pages itself instead of waiting for
kswapd. Theminwatermark represents a critical level of free memory that the allocator tries to protect. As memory gets very low, allocations may enter direct reclaim, and in severe cases the system can eventually reach the point where the OOM killer is invoked.
Now let’s talk about Reclaim algorithms. Linux has 2 main ones:
- LRU: This is the traditional one, and you find it on older Kernels.
This is where you have
activeandinactivelists of pages and it evicts from theinactivelist. - MGLRU: Added in Linux 6.1 and enabled by default by many distros, it optimizes page reclaim and improves performance under memory pressure.
Reference:
- Linux Kernel Internals - Page Reclaim
- Kernel Docs - Reclaim
- Kernel Docs - MGLRU
- AWS Docs - Kernel MGLRU
Page Faults
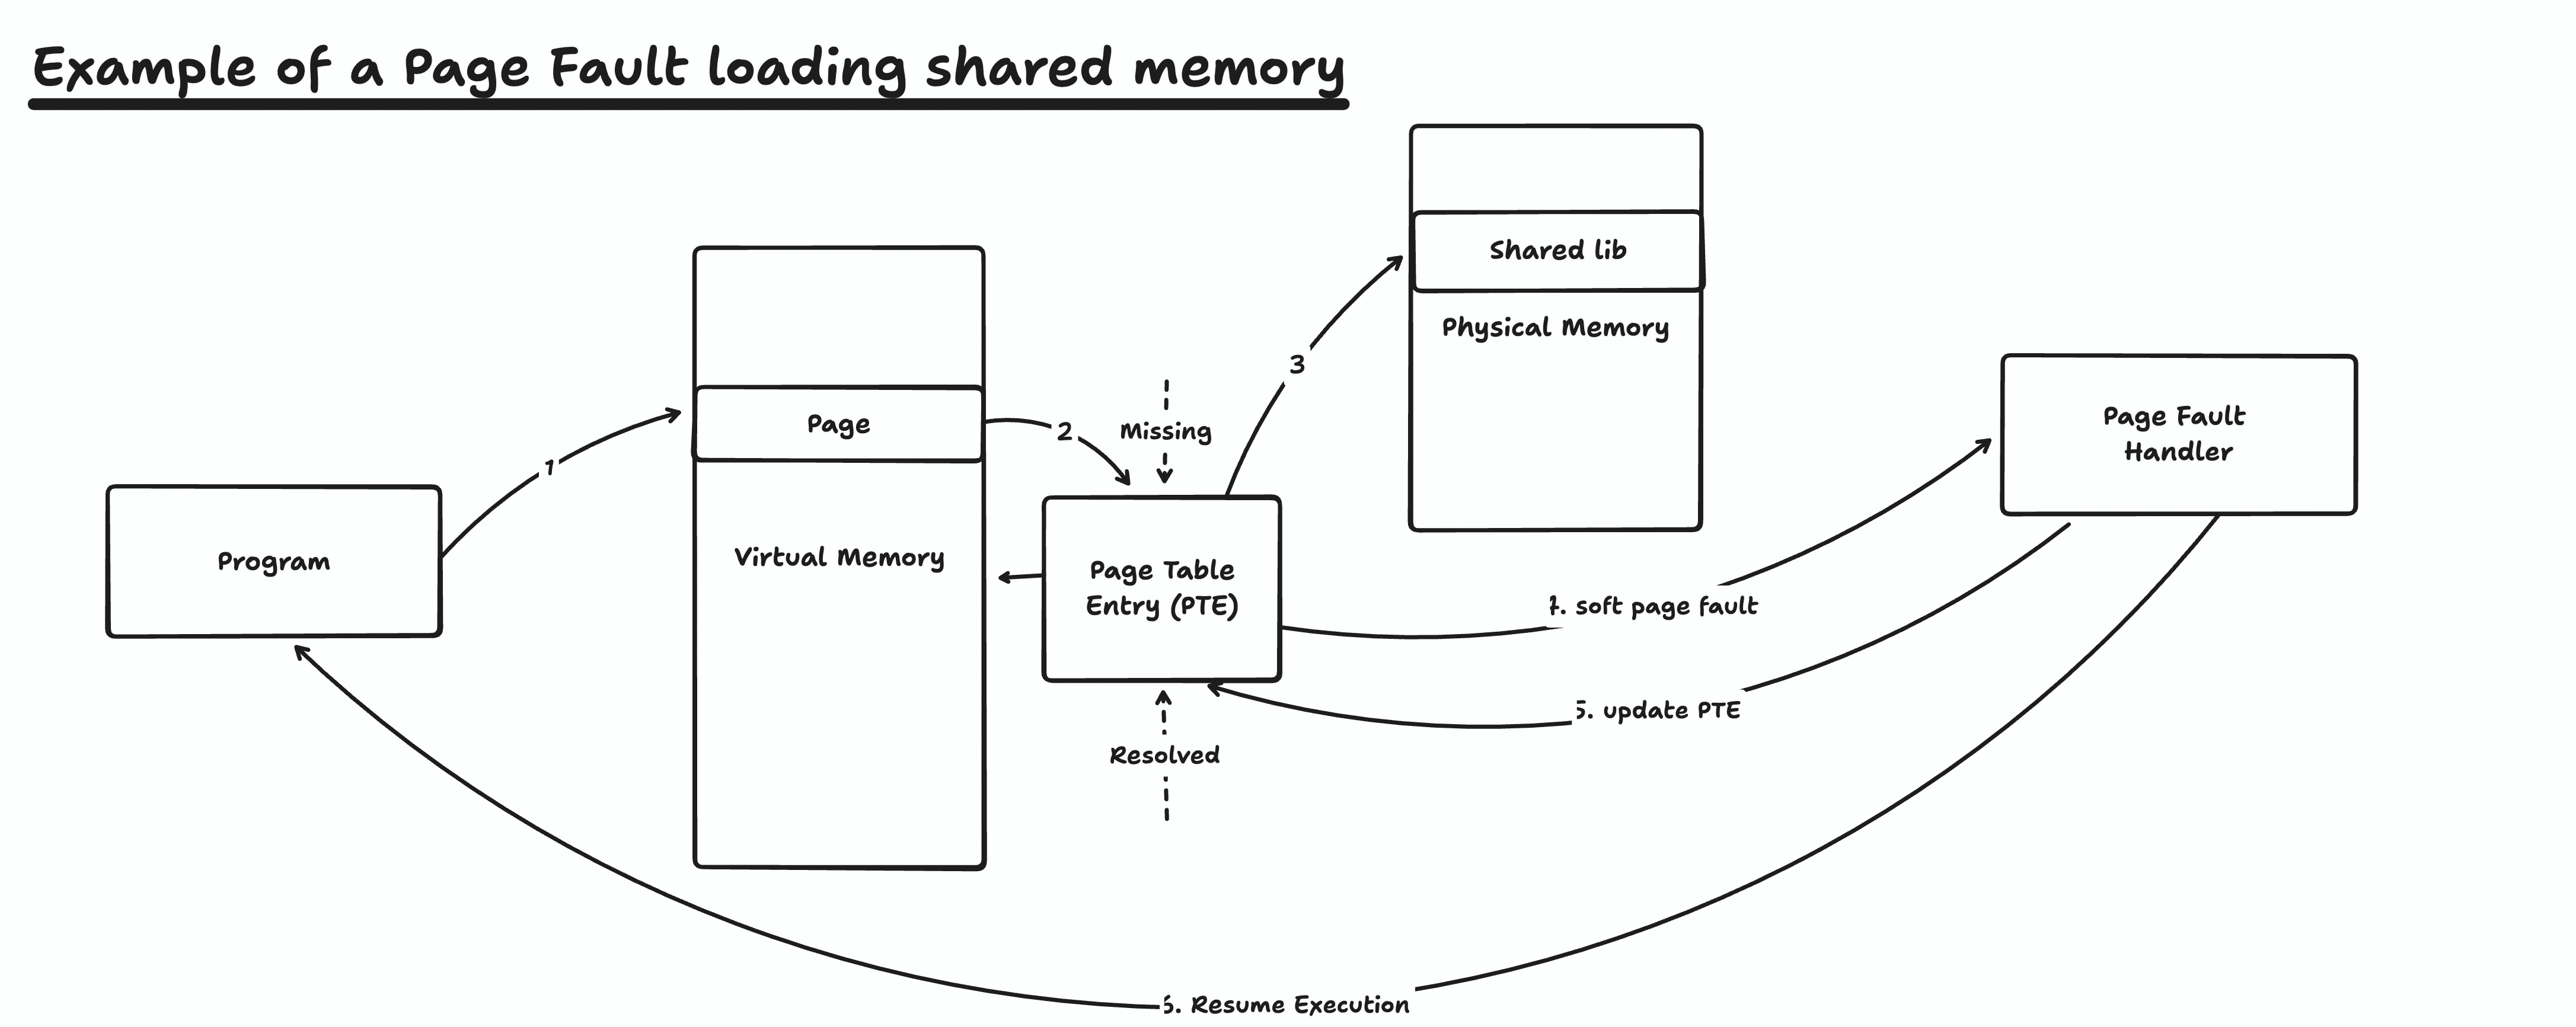
When a program tries to access Virtual Memory but that Page doesn’t map to any usable Physical Page an exception called a Page Fault is raised. When this exception is raised, the Page Fault Handler handles it by locating and retrieving the missing page and updating the page table.
There are two types of page faults:
- Minor/Soft: When the data is already in RAM but not mapped in the Virtual Memory for the process like shared memory.
- Major/Hard: When the data is not in RAM and needs to be loaded from disk either swap for anonymous memory or a file for page cache.
Page Faults usually result in performance degradation because handling the exception requires a transition from userland to the kernel.
Why do we end up in these situations?
- Reclaim: any file-backed memory or page cache that was reclaimed.
- Swap: anonymous pages are moved to disk from RAM.
- Lazy Allocation/Loading: the kernel doesn’t load a physical page when virtual memory is initially created. The physical page may only be allocated or loaded when the program first accesses it.
Reference:
OOM Killer
So far we’ve talked about how memory gets allocated, and how it can be reclaimed. What happens if the Linux Kernel can’t keep up, and there is memory pressure? This is where the OOM killer comes in and terminates a process to free up memory.
The OOM Killer decides which process to kill by what it calls “badness”, going through the scoring components.
We’ll talk about observability a bit later, but the best way to start to debug an OOM event is looking at dmesg.
There is also another case where the OOM Killer can get invoked without any system-wide memory pressure: when running cgroups/containers.
With cgroups, a single process or multiple processes are tracked together, and a maximum memory limit can be configured for the cgroup (memory.max in cgroup v2).
When the cgroup reaches its limit, the kernel first tries to reclaim memory within the cgroup, like dropping page cache or swapping.
Only if that isn’t enough does the OOM killer pick a process in the cgroup to kill.
Reference:
- Linux Kernel Internals - Reading an OOM log
- Linux Kernel Internals - Running out of memory
- Linux Kernel Internals - Memory Cgroups (memcg)
Observability
We’ve covered a lot of behavior, but how do we observe all of this for our applications running in production? What tools can we use?
I’ll start with high-level monitoring and work my way towards more fine-grained debugging tools.
Metrics:
The easiest place to start is with an observability stack like Prometheus. With exporters such as Node Exporter and cAdvisor, we can monitor memory usage, available memory, page cache, swap, page faults, and other useful metrics.
The important thing is knowing which metrics are available and what they actually tell us.
Linux exposes many of its virtual memory statistics through /proc/vmstat, while /proc/sys/vm exposes configurable kernel VM parameters. Exporters expose some of these statistics as Prometheus metrics, but the exact metrics available depend on the exporter and its configuration.
These metrics help us understand how memory is being used and what the kernel is doing, but they don’t always tell us whether memory pressure is actually affecting our applications.
Pressure Stall Information (PSI):
This is where PSI comes in. PSI gives us signals that help answer a more important question: Is memory pressure affecting my workload?
Let’s look at an example:
$ cat /proc/pressure/memory
some avg10=0.12 avg60=0.08 avg300=0.04 total=123456
full avg10=0.01 avg60=0.00 avg300=0.00 total=12345
What does that even mean?
some: At least one non-idle task is stalled waiting for memory resources.full: All non-idle tasks are stalled simultaneously waiting for memory resources.
The avg10, avg60, and avg300 values represent the percentage of time spent stalled over rolling windows of 10, 60, and 300 seconds. The total value is the cumulative stall time in microseconds since the counters were initialized.
PSI is particularly useful because high memory usage doesn’t necessarily mean there’s a problem. A system can use most of its RAM for reclaimable page cache without significantly affecting its workloads. PSI helps us understand whether memory contention is actually causing tasks to stall.
Fine-grained debugging:
Sometimes, aggregated metrics aren’t enough. Metrics are typically collected at intervals, which means short-lived spikes and events can be missed. When we need to investigate what’s happening at a particular moment, we can SSH into the machine and use tools that provide more detailed information.
Here are a few worth knowing:
- BCC: A collection of eBPF-based tools for tracing Linux behavior. For example,
oomkilltraces OOM-killer events, whilememleakhelps identify outstanding allocations that may indicate memory leaks. vmstat: A quick overview of memory, swap activity, page faults, and other system activity over time.- Memory Flame Graphs: Useful visualizations for investigating memory allocation behavior and identifying expensive call paths.
- Go
pprof: If you’re running Go applications, the runtime provides profiling tools that can help identify where heap allocations originate and how much memory is retained by live objects.
These tools let us move from observing symptoms to investigating what’s actually happening inside the kernel or our applications.
cgroups & Containers:
If your workload runs in containers/cgroups you also have access to some information about memory.
With cgroup v2, these are files in the cgroup’s directory (for example under /sys/fs/cgroup/):
memory.max: The hard limit. Hitting it triggers reclaim, and then the OOM killer if reclaim isn’t enough.memory.high: A soft limit. Going over it throttles the cgroup and forces reclaim, but doesn’t invoke the OOM killer.memory.current: Current memory usage of the cgroup. This includes page cache, so on its own it can look scarier than it is.memory.peak: The highest usage recorded, which helps catch short spikes that metrics scraped at intervals miss.memory.events: Counters forhigh,max,oom, andoom_kill. A risingmaxcount means the cgroup keeps hitting its limit, andoom_killconfirms processes were killed.memory.stat: A breakdown of usage, such asanon,file,file_dirty, andfile_writeback, pluspgfaultandpgmajfault. This is how you tell whether usage is anonymous memory (likely a leak or real demand) or reclaimable page cache.memory.pressure: PSI scoped to the cgroup, so you can see whether this workload is stalling on memory, not just the whole machine.memory.swap.current: How much of the cgroup’s memory has been swapped out.
Reference:
- Prometheus — Monitoring Linux host metrics with Node Exporter
- cAdvisor — Prometheus metrics
- Linux kernel documentation — VM sysctl parameters
- Linux kernel documentation — PSI
- BCC — Linux tracing tools
- LISA19 — Linux Systems Performance
Closing
This is a high-level overview, and there is a lot more we can dig into, like slabs, huge pages, and Virtual Memory Areas (VMAs), but the topics above are an entry point to get you started with Linux memory management.