When reading the Systems Performance: Enterprise and the Cloud, 2nd Edition
(2020)
by Brendan Gregg, I saw that each chapter has an Exercises section with a set
of questions. This series of blogs will be my attempt to answer them and also
give additional links I’ve read whilst reading the chapter. The answers might
not be correct, not detailed but this is to help me explain what I learned to
make sure I understand it.
You can follow system-performance-book for this series.
Exercises
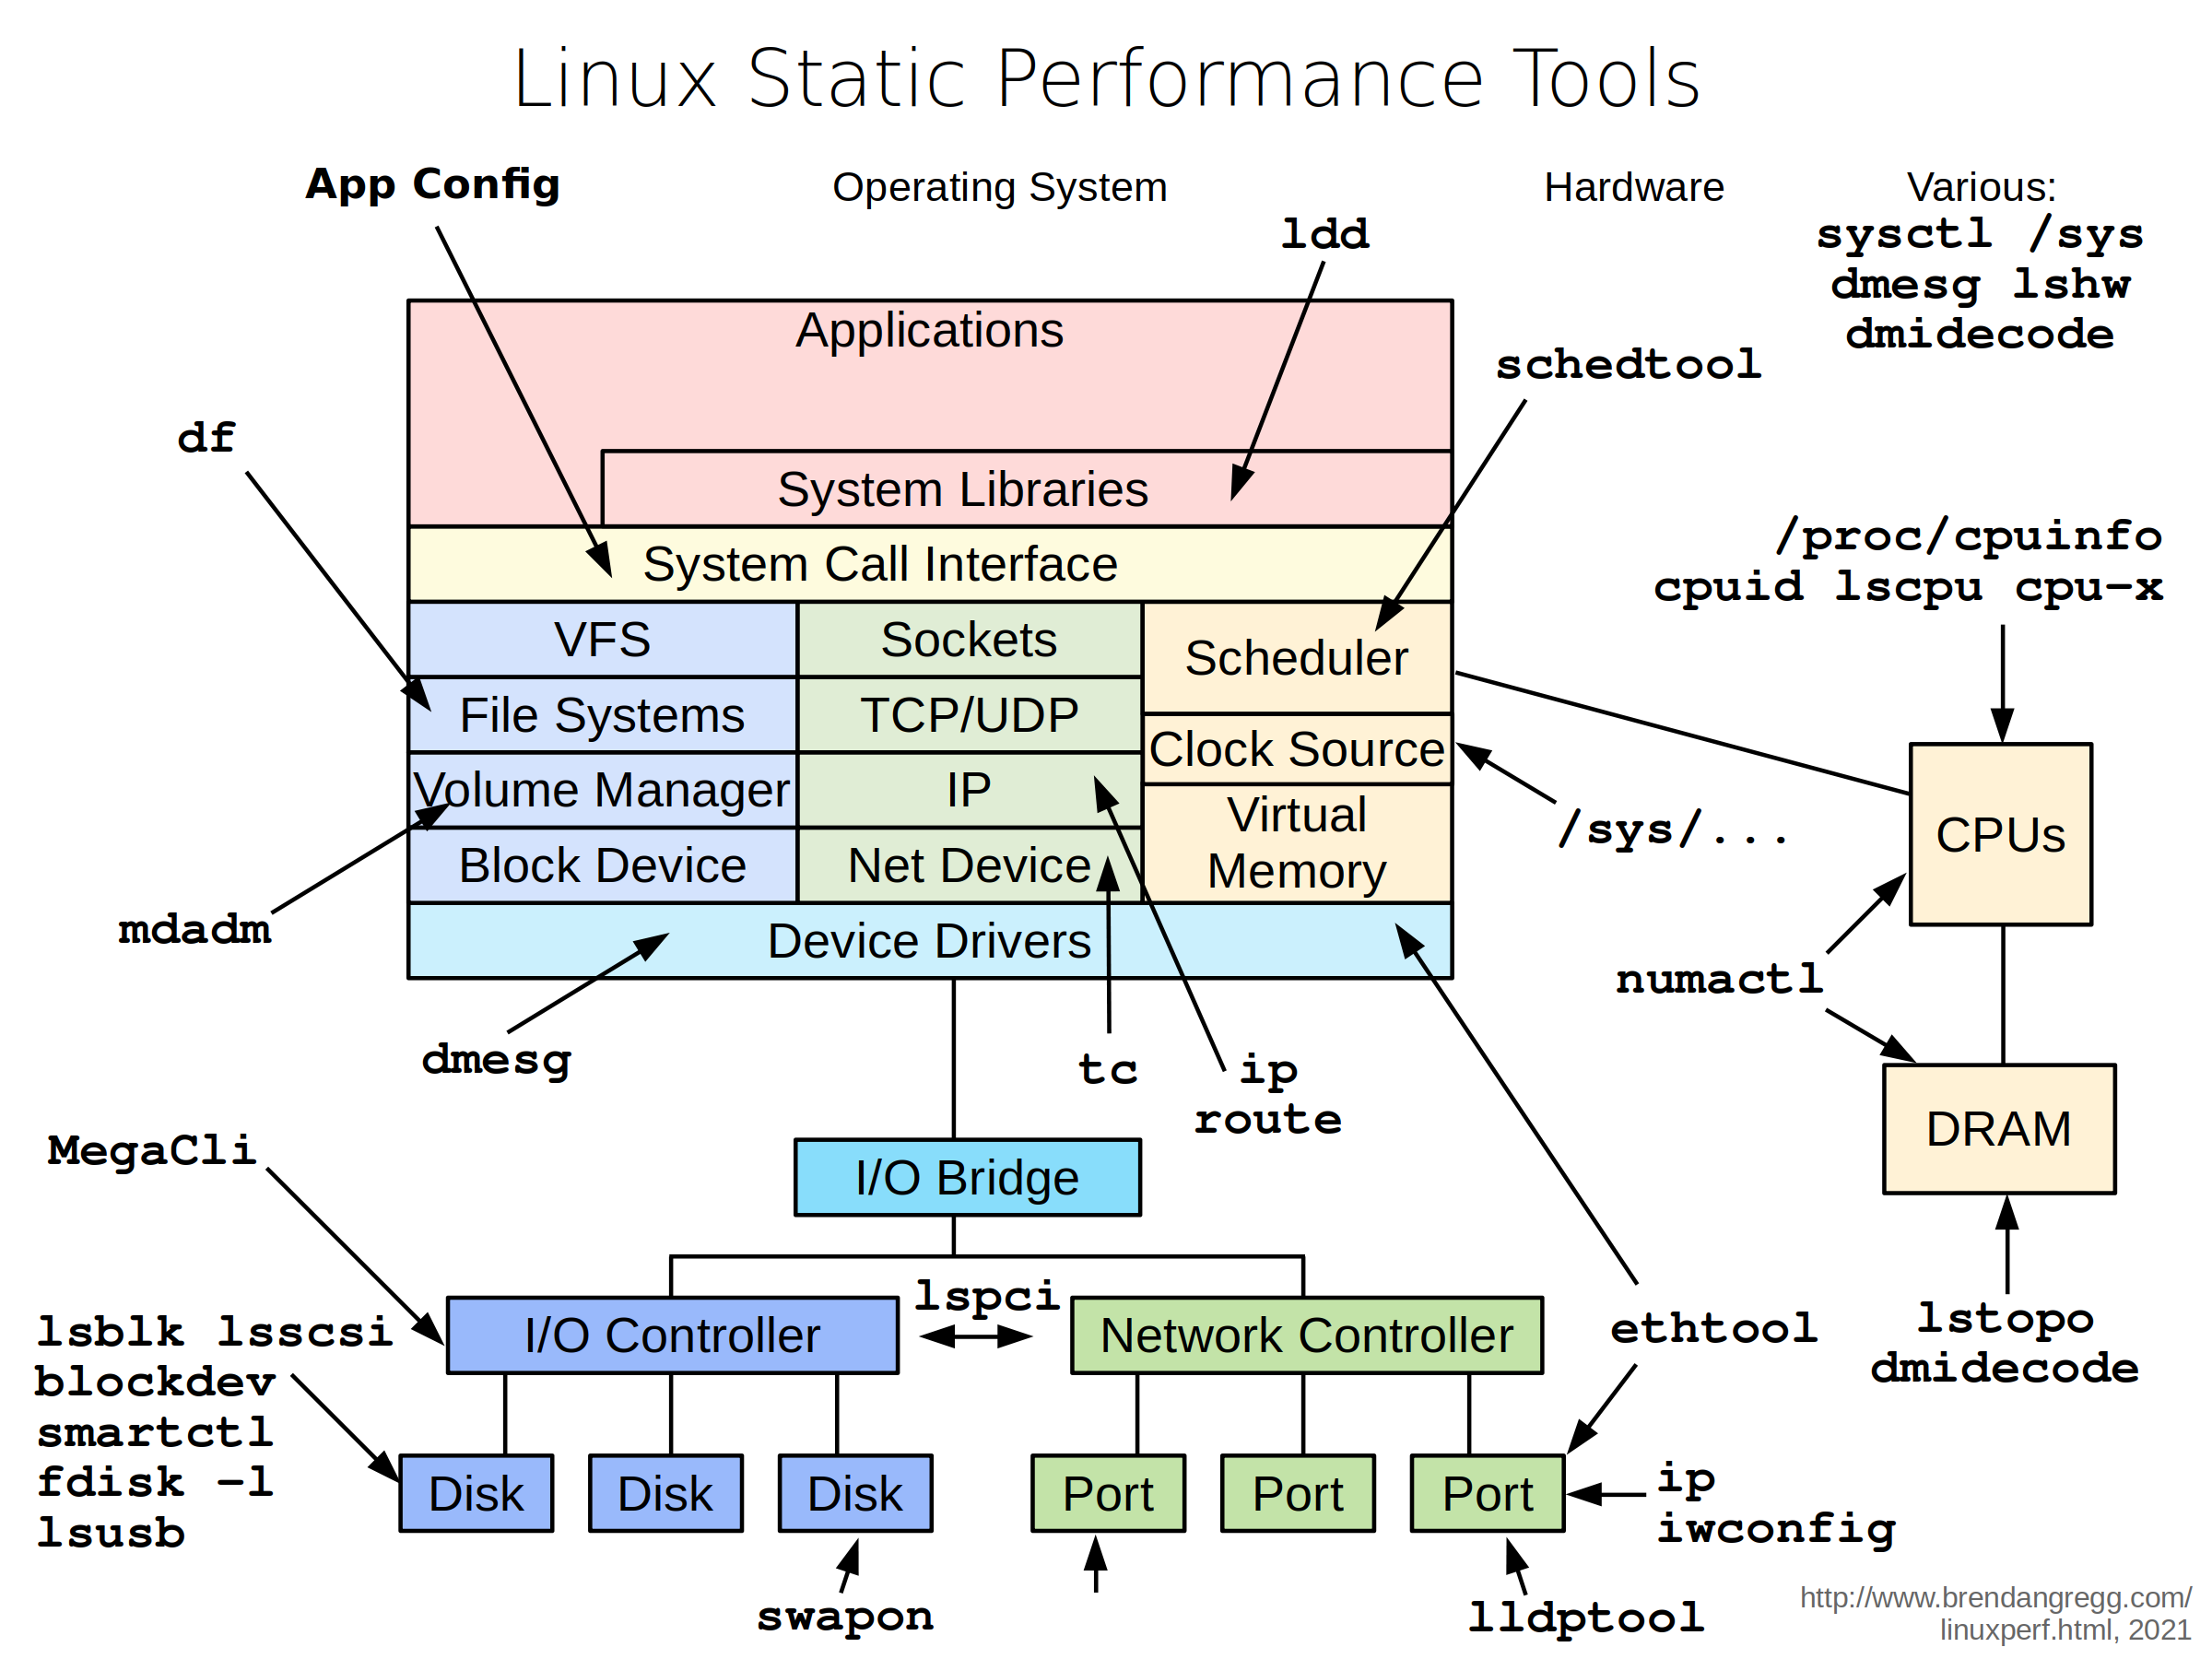
List some static performance tools.
These are tools to use when the system is at rest. It’s check if the configuration of the machine makes sense.
Some examples of tool that you can use:
What is profiling?
Profiling is used to get a better understanding of the workload by checking which part of the application is using the most CPU time, the stacktrace, and also memory usage patterns. It also shows you internal behavior of the workload for example if you are using a programming langugage that has garbage collection is will show you when grabage collection ran and how much memory and CPU it used. This is done by collecting samples and snapshot of the workload behavior.
This is usually something that the administraor run for a short period of time since it has some performance overhead and can use up disk space.
Why would profilers use 99 Hertz instead of 100 Hertz?
To avoid sampling in lockstap with the target activity which could lead to undercounting. This is because the samples are collected at 100 Hz
What is tracing?
See when a specific call/method is called, how long it took, and the stacktrace to see what called it. You can also see the input and output values of the call. When tracing a specific call this will collect all the calls to that call, and doesn’t sample the calls.
What is static instrumentation?
When the application developer writes instrumentation code as part of the application.
Describe why dynamic instrumentation is important.
This creates instrumentation points after the software is compiled and running.
For exampke kprobes provide a way for the user to create dynamic
instrumentation.
It’s important because you can investigate performance issues and instrument the application on the fly without modifying the source code which can give you feedback about the problem.
What is the difference between tracepoints and kprobes?
tracepoint: This is static instrumentation which is added and maintained by kernel developers at specific parts of the kernel codebase. They are able to provide deepter insights into kernel behavior since they provide a stable interface. Even when the tracepoints are disabled there is some small overhead on the CPU. kprobes: Let’s you dynamically instrument the kernel when it’s running even if there are not tracepoints available. There is not stable API for kprobes, which change from version to version.
Describe the expected CPU overhead (low/medium/high) from the following:
- Disk IOPS counters (as seen by iostat(1)): Low since it uses fixed counters from the kernel.
- Tracing per-event disk I/O via tracepoints or kprobes: Medium
- Tracing per-event context switches (tracepoints/kprobes): Medium
- Tracing per-event process execution (execve(2)) (tracepoints/kprobes): Medium
- Tracing per-event libc malloc() via uprobes: High
Describe why PMCs are valuable for performance analysis.
It’s the only way that you can get the following information:
- CPU instructions.
- Hit ratio of CPU cache.
- Memory and device buses utilization.
- Interconnect utilization.
- Stall cycles.
Given an observability tool, describe how you could determine what instrumentation sources it uses.
You can you strace to look at the system calls and the files it’s opening.