You can use the go trace tool to look at the CPU traces to see how your program is behaving for example.
package main

import (
	"fmt"
	"os"
	"runtime/trace"
)

func main() {
	f, err := os.Create("trace.out")
	if err != nil {
	    panic(err)
	}
	defer f.Close()
	err = trace.Start(f)
	if err != nil {
	    panic(err)
	}
	trace.Stop()

	fmt.Println("hello")
}
When you run the program you will see a new file trace.out which has
the trace we want to inspect.
go tool trace trace.out
2020/07/21 20:37:37 Parsing trace...
2020/07/21 20:37:37 Splitting trace...
2020/07/21 20:37:37 Opening browser. Trace viewer is listening on http://127.0.0.1:50608
Now if we click on the View Trace link we end up seeing
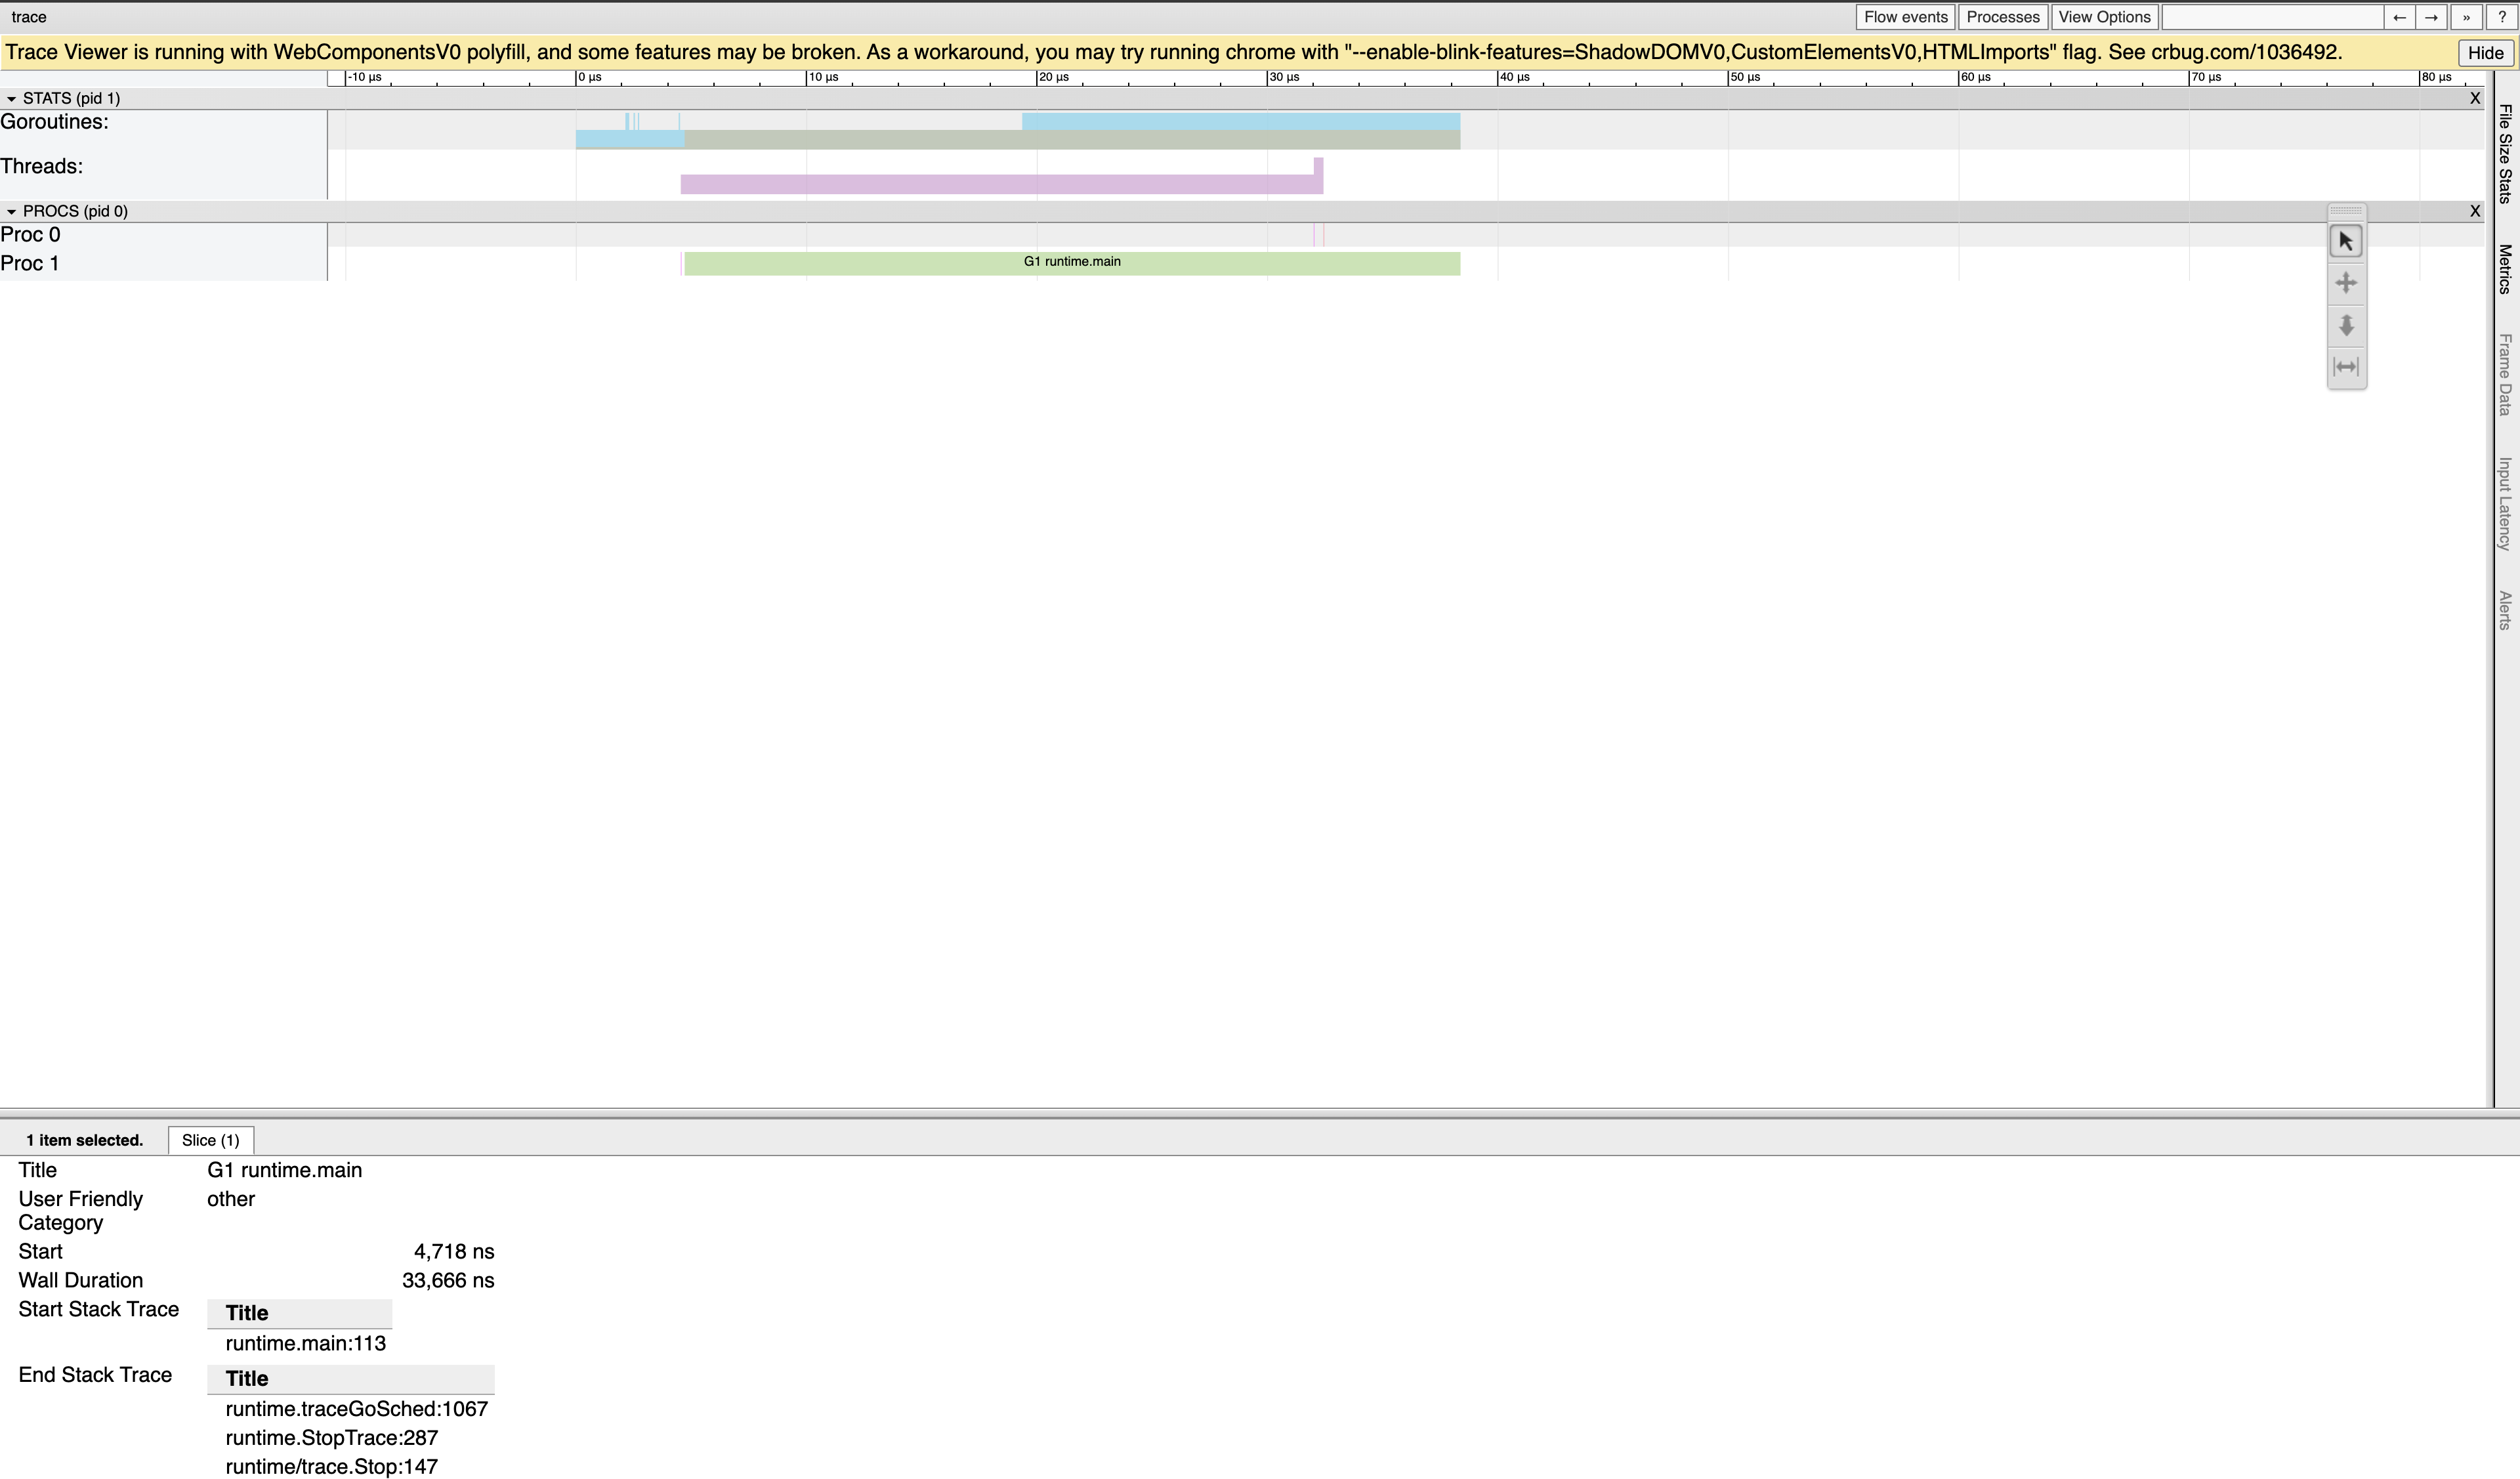
The UX is not the best and sometimes it’s not very clear how to navigate
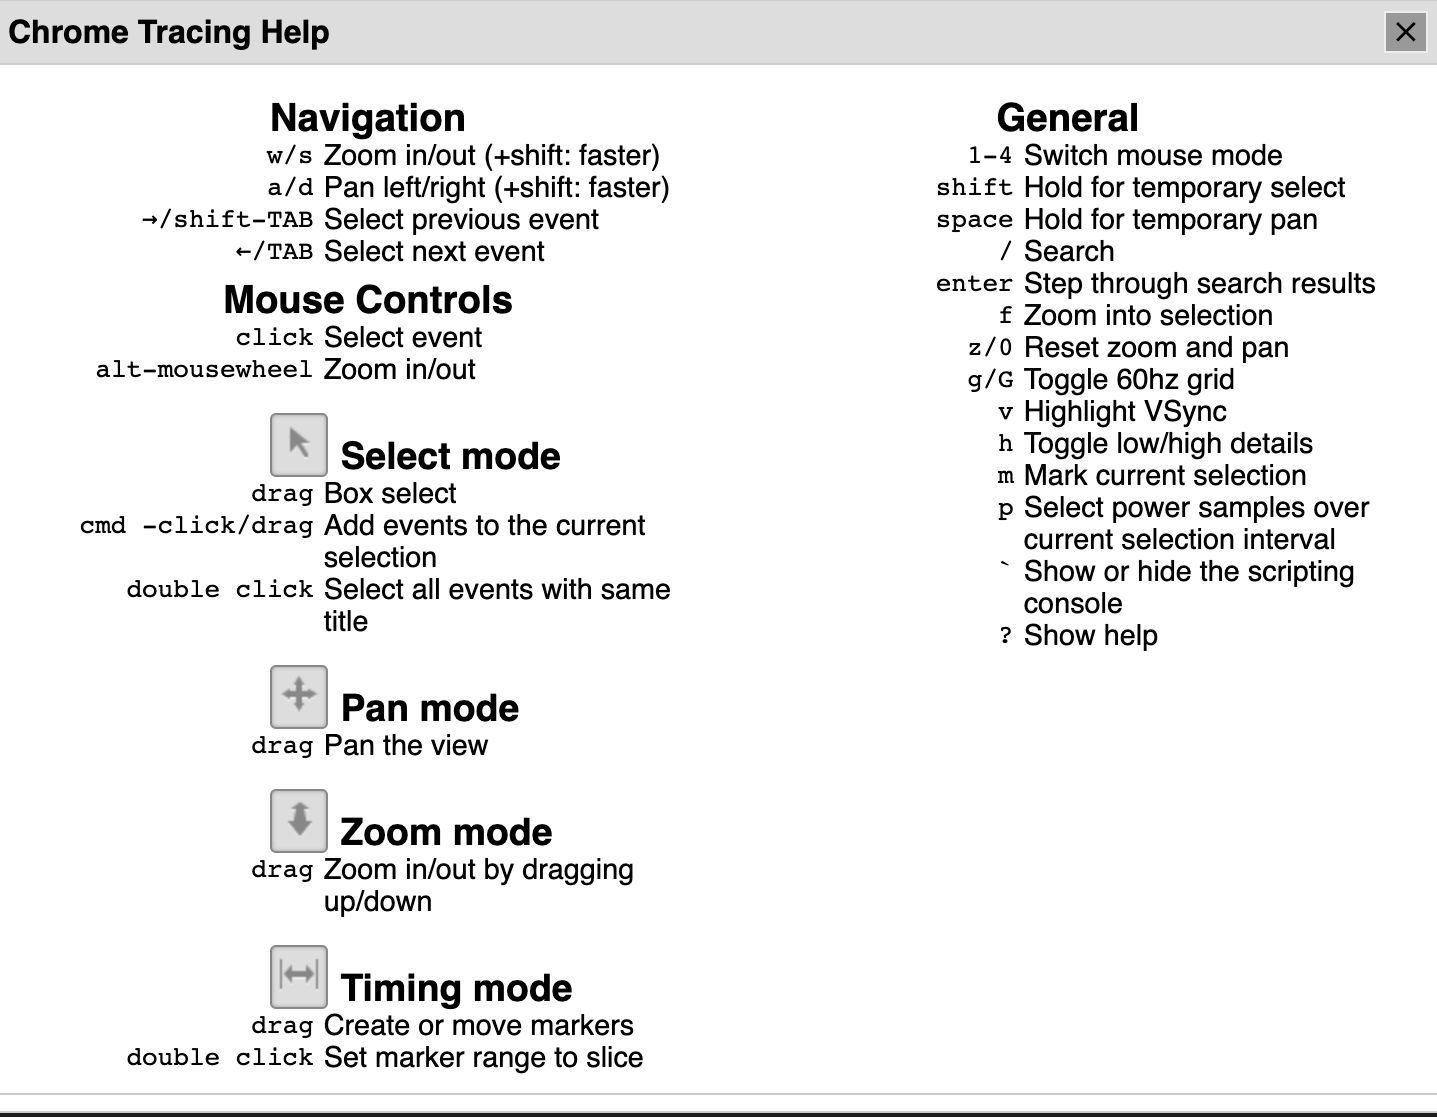
the interface. If you type ? in your browser window where you have the
trace is open you see all the shortcuts to navigate.