Go has a lot of tools available for you to understand where your application might be spending CPU time or allocating memory. I don’t use these tools daily so I always end up searching for the same thing every time. This post aims to be a reference document for everything that Go has to provide.
We’ll be using https://gitlab.com/steve-blog/go-performance-tools-cheat-sheet as a demo project and there are 3 implementations of the same thing, one more performant than the other.
Benchmarks
One of the most popular ways to see if you improved something is to use Benchmarks which is built into Go.
In our demo project, there is already benchmarks avaiable and we can run them with a single command.
go test -bench=. -test.benchmem  ./rand/

goos: darwin
goarch: amd64
pkg: gitlab.com/steve-blog/blog/go-performance-tools-cheat-sheet/rand
cpu: Intel(R) Core(TM) i7-6820HQ CPU @ 2.70GHz
BenchmarkHitCount100-8              3020            367016 ns/op          269861 B/op       3600 allocs/op
BenchmarkHitCount1000-8              326           3737517 ns/op         2696308 B/op      36005 allocs/op
BenchmarkHitCount100000-8              3         370797178 ns/op        269406189 B/op   3600563 allocs/op
BenchmarkHitCount1000000-8             1        3857843580 ns/op        2697160640 B/op 36006111 allocs/op
PASS
ok      gitlab.com/steve-blog/blog/go-performance-tools-cheat-sheet/rand 8.828s
Note: -test.benchmem is an optional flag to show memory allocations
Taking a closer look at what each column means:
BenchmarkHitCount100-8              3020            367016 ns/op             269861 B/op               3600 allocs/op
^------------------^ ^                ^                   ^                      ^                          ^
         |           |                |                   |                      |                          |
       Name   Number of CPUs     Total runs    Nanoseconds per operation   Bytes per operation   Allocations per operations
Comparing Benchmarks
Go created perf which provides benchstat so that you can compare to benchmark outputs together and it will give you the delta between them.
For example, let’s compare the
main
and
best
branches.
# Run benchmarks on `main`
git checkout main
go test -bench=. -test.benchmem -count=5 ./rand/ > old.txt

# Run benchmarks on `best
git checkout best
go test -bench=. -test.benchmem -count=5 ./rand/ > new.txt

# Compare the two benchmark results
benchstat old.txt new.txt
name               old time/op    new time/op    delta
HitCount100-8         366µs ± 0%     103µs ± 0%  -71.89%  (p=0.008 n=5+5)
HitCount1000-8       3.66ms ± 0%    1.06ms ± 5%  -71.13%  (p=0.008 n=5+5)
HitCount100000-8      367ms ± 0%     104ms ± 1%  -71.70%  (p=0.008 n=5+5)
HitCount1000000-8     3.66s ± 0%     1.03s ± 1%  -71.84%  (p=0.016 n=4+5)

name               old alloc/op   new alloc/op   delta
HitCount100-8         270kB ± 0%      53kB ± 0%  -80.36%  (p=0.008 n=5+5)
HitCount1000-8       2.70MB ± 0%    0.53MB ± 0%  -80.39%  (p=0.008 n=5+5)
HitCount100000-8      270MB ± 0%      53MB ± 0%  -80.38%  (p=0.008 n=5+5)
HitCount1000000-8    2.70GB ± 0%    0.53GB ± 0%  -80.39%  (p=0.016 n=4+5)

name               old allocs/op  new allocs/op  delta
HitCount100-8         3.60k ± 0%     1.50k ± 0%  -58.33%  (p=0.008 n=5+5)
HitCount1000-8        36.0k ± 0%     15.0k ± 0%  -58.34%  (p=0.008 n=5+5)
HitCount100000-8      3.60M ± 0%     1.50M ± 0%  -58.34%  (p=0.008 n=5+5)
HitCount1000000-8     36.0M ± 0%     15.0M ± 0%  -58.34%  (p=0.008 n=5+5)
Notice that we pass the -count flag to run the benchmarks multiple times so it
can get the mean of the runs.
pprof
Go comes with its own profiler where it will give you a better understanding of where the CPU time is being spent on or where the application is allocatingthe memory. Go samples these over some time for example it will look at the CPU/Memory usage every X nanoseconds for X amount of seconds.
Generating Profiles
Benchmarks
You can generate profiles using benchmarks that we have in the demo project.
CPU:
go test -bench=. -cpuprofile cpu.prof ./rand/
Memory:
go test -bench=. -memprofile mem.prof ./rand/
net/http/pprof package
If you are writing a webserver you can import the
net/http/pprof and it will expose
the /debug/pprof HTTP endpoints on the DefaultServeMux as we are doing
in the demo application.
Make sure that your application is not sitting idle and doing work or receiving requests so that the profiler can sample calls, or you might end up with an empty profile since the application is idle.
# CPU profile
curl http://127.0.0.1:8080/debug/pprof/profile > /tmp/cpu.prof
# Heap profile
curl http://127.0.0.1:8080/debug/pprof/heap > /tmp/heap.prof
# Allocations profile
curl http://127.0.0.1:8080/debug/pprof/allocs > /tmp/allocs.prof
If you visit /debug/pprof it will give a list of all the available
endpoints and what they mean.
runtime/pprof package
This is similar to the net/http/pprof where add it to your
application, but instead of adding for all of the project, you can
specify a specific code path where you want to generate the profile.
This can be useful when you are only interested in a certain part of
your application and you want to sample only that part of the
application. To read how to use it check the go
reference.
You might also use this to label your application which can help you understand the profile better.
Reading profiles
Now that we know how to generate profiles, let’s see how we can read them to know what our application is doing.
The command that we will be using is go tool pprof.
Callgraph
For example to use the /debug/pprof endpoints that we have
registered
in our demo application, we can pass in the HTTP endpoint directly.
# Open new browser window with call graph after 30s profiling.
go tool pprof -http :9402 http://127.0.0.1:8080/debug/pprof/profile
Another option is to use curl to download the profile and then use go tool which might be useful to get profiles from production endpoints
that aren’t exposed to the public internet.
# Server.
curl http://127.0.0.1:8080/debug/pprof/profile > /tmp/cpu.prof
# Locally after you get it from the server.
go tool pprof -http :9402 /tmp/cpu.prof
Notice that in all the commands we are passing the -http flag, this is
optional because by default this opens the CLI interface.
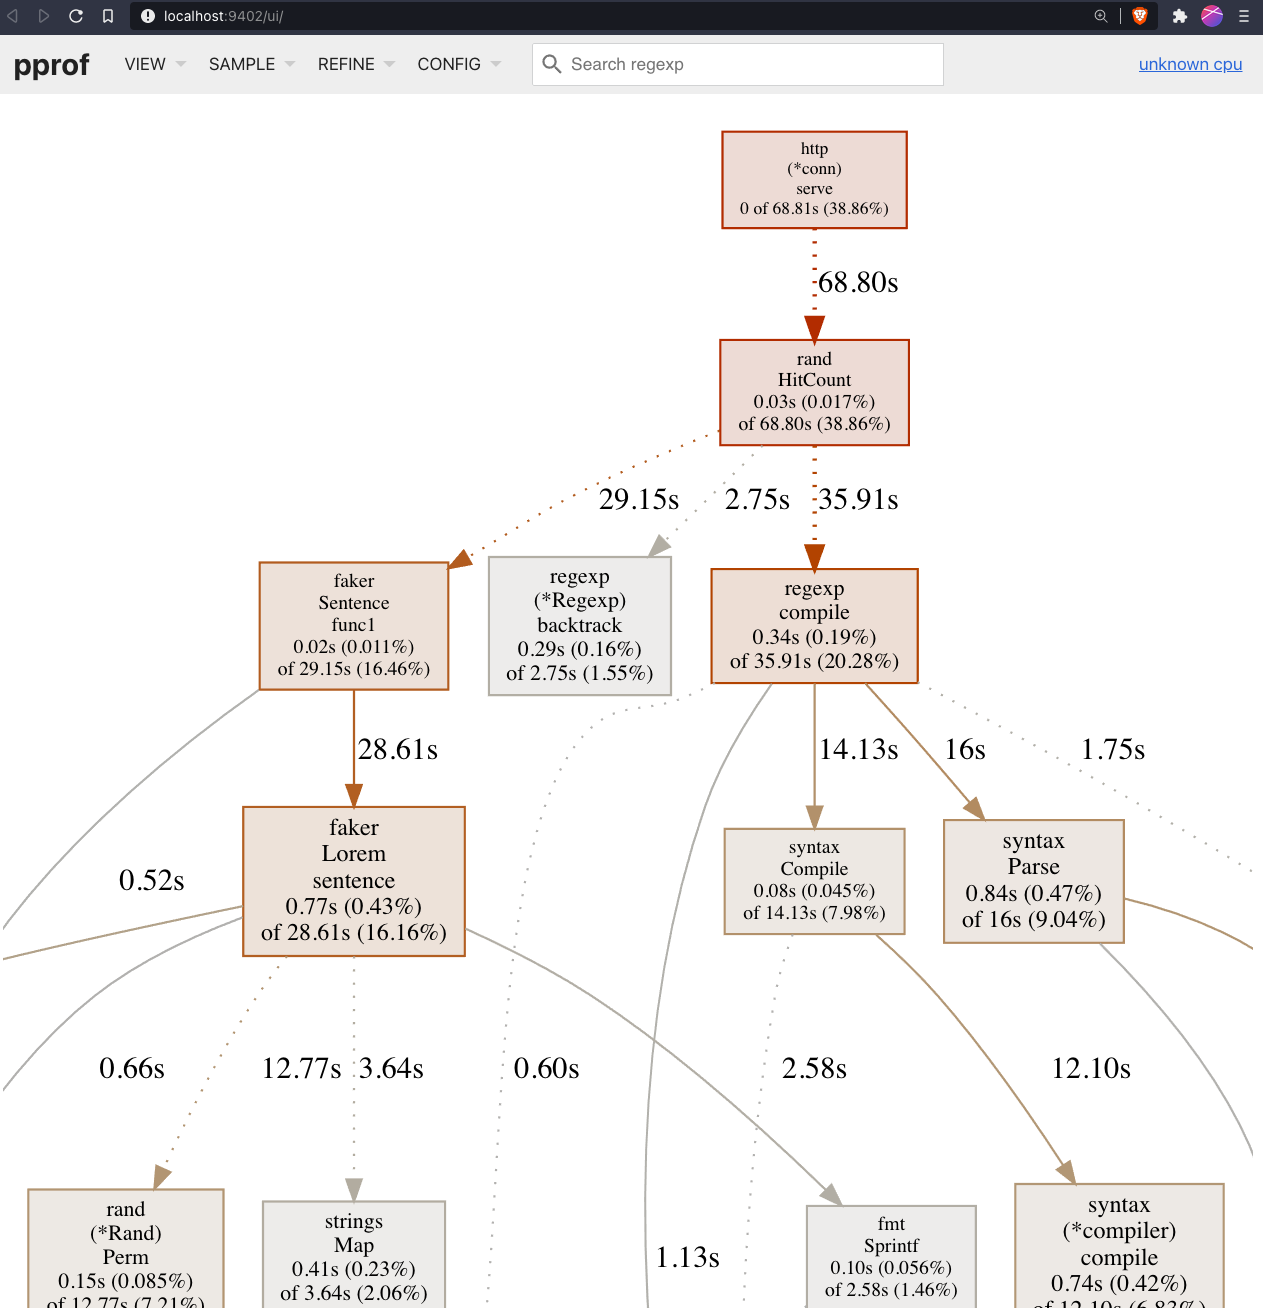
Below you can see our demo application call graph. To better understand what it means you should read Interpreting the Callgraph
Flame graphs
The callgraph is useful to see what the program is calling and can also help you understand where the application is spending time. An alternative way of understanding where the CPU time or memory allocation is going is to use a Flame Graph.
Using the same demo application let’s run go tool pprof once more:
# From endpoint
go tool pprof -http :9402 http://127.0.0.1:8080/debug/pprof/profile
# From the local profile
go tool pprof -http :9402 /tmp/cpu.prof
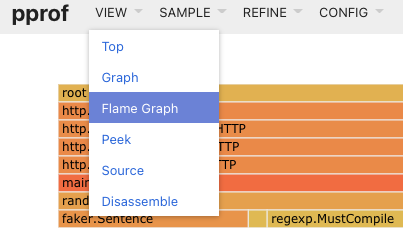
However this time we will use the top navigation bar go to View >
Flame Graph
Then you should see something like below:
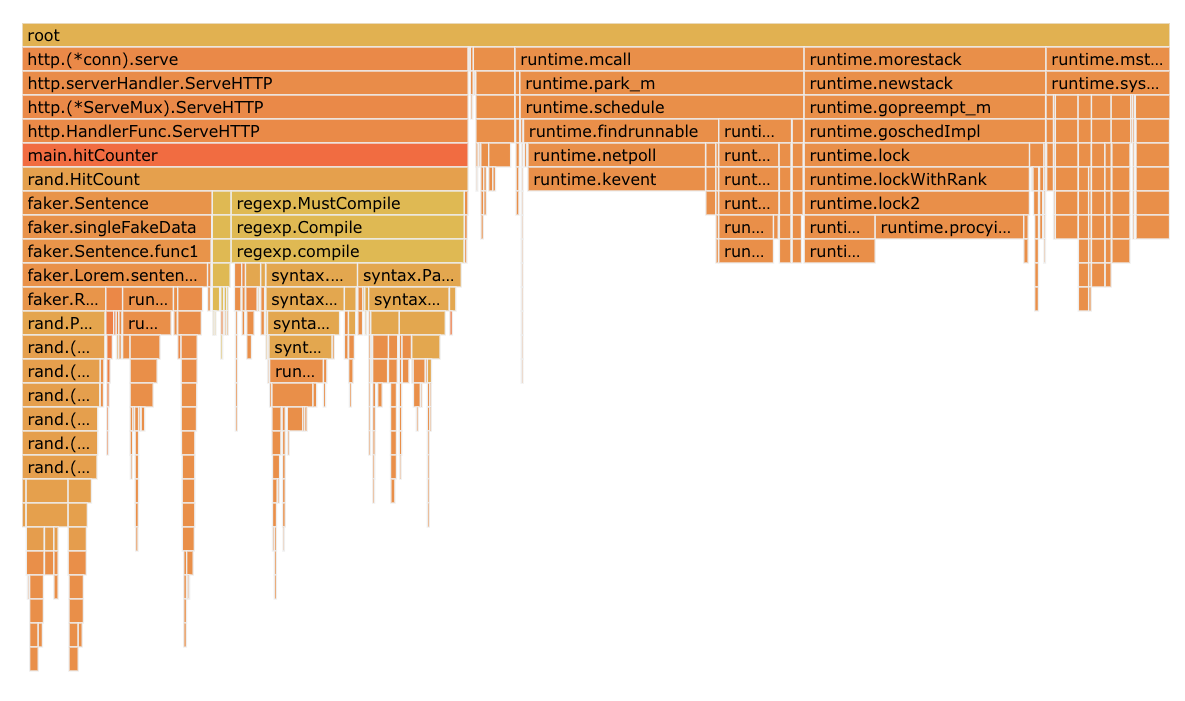
For you to better understand how to read flame graphs you can check out What Are Flame Graphs and How to Read Them, RubyConfBY 2017
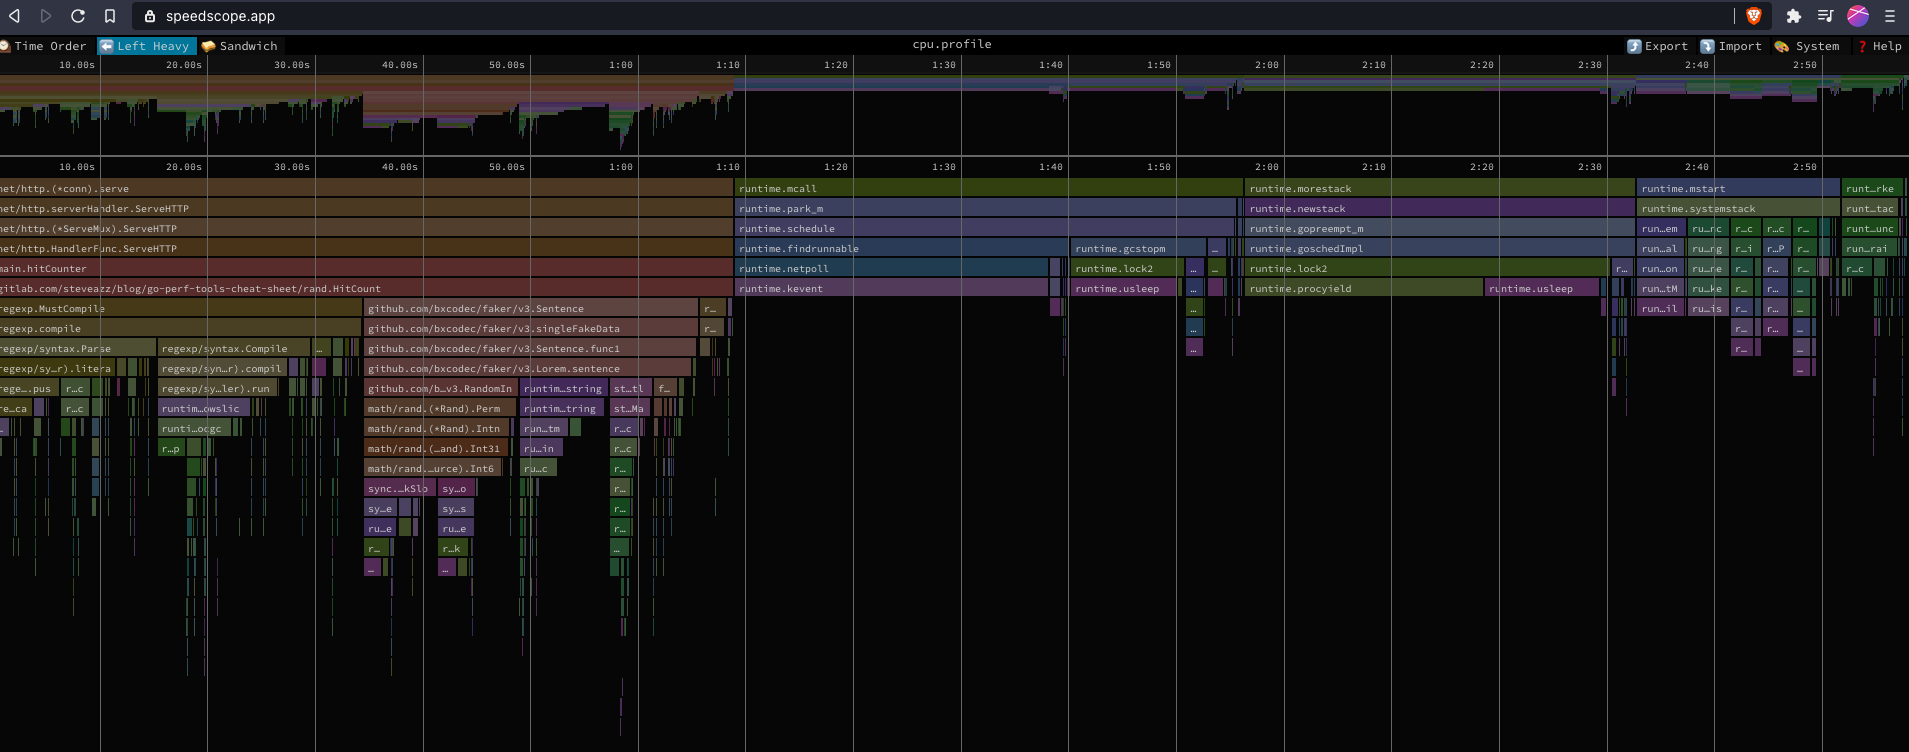
You can also use speedscope which is a language-agnostic application to generate flame graphs from profiles and it’s a bit more interactive than the one provided from Go.
Comparing profiles
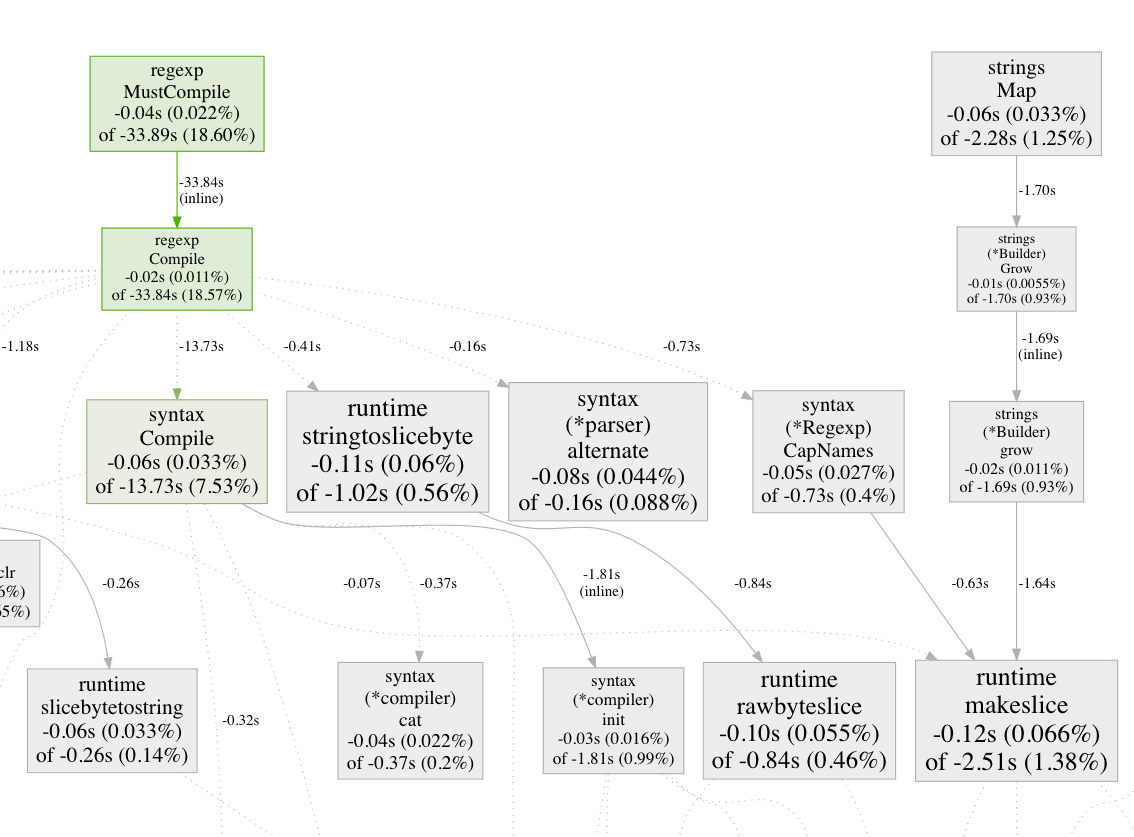
The go tool pprof also allows you to use to compare
profiles
to show you the difference between 1 profile and another.
Using our demo project once again we can generate profiles for the
main and best branches.
# Run on `main`
curl http://127.0.0.1:8080/debug/pprof/profile > /tmp/main.prof

# Run on `best`
curl http://127.0.0.1:8080/debug/pprof/profile > /tmp/best.prof

# Compare profiles
go tool pprof -http :9402 --diff_base=/tmp/main.prof /tmp/best.prof
Traces
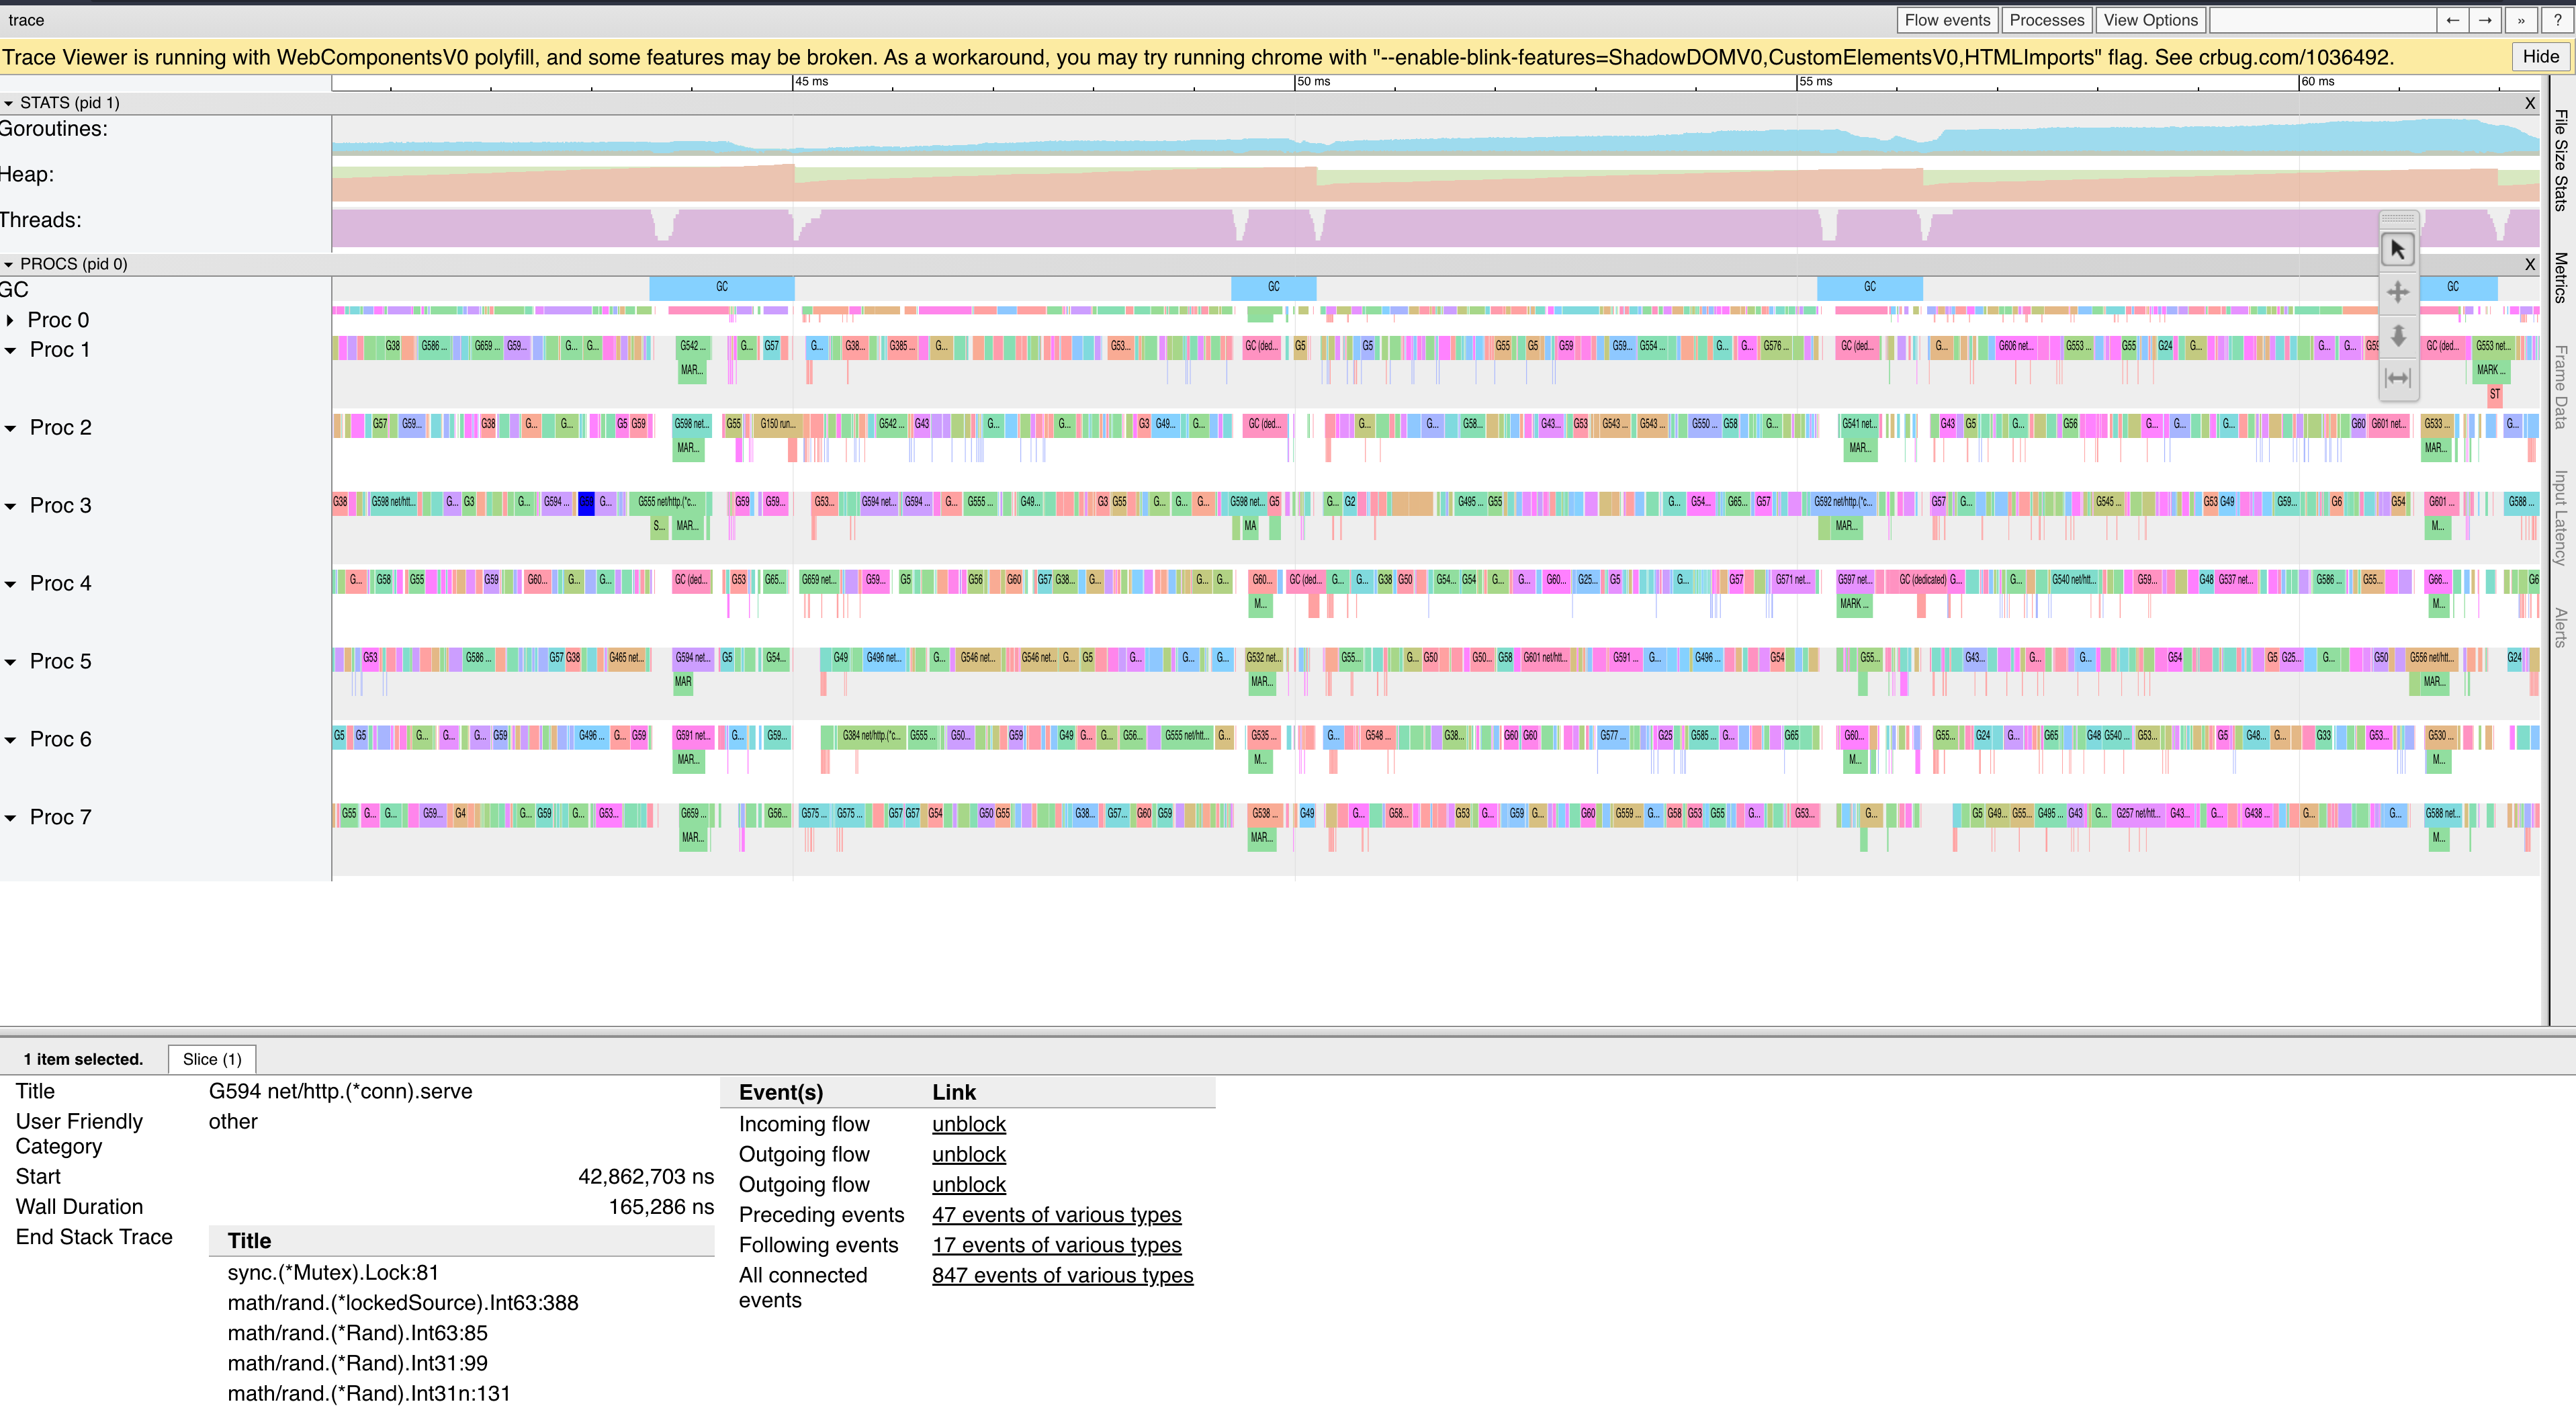
One last tool that we need to go through is the CPU tracer. This gives you an accurate representation of what was happening during the program execution. It can show you which cores are sitting idle and which ones are busy. This is great if you are debugging some concurrent code that isn’t performing as expected.
Using our demo application again let’s get the CPU trace using the
/debug/pprof/trace endpoint that is added using the net/http/pprof.
curl http://127.0.0.1:8080/debug/pprof/trace > /tmp/best.trace

go tool trace /tmp/best.trace
A more detailed explanation of the tracer can be found over at Gopher Academy Blog
